The first page after authentication is the Dashboard. It provides quick access to essential modules and key insights into daily company statistics.
Dashboard
Upon opening the Dashboard, the basic User information is displayed (First Name, Last Name, Avatar, Last Login time & date). Below that, you’ll find useful quick-access buttons:
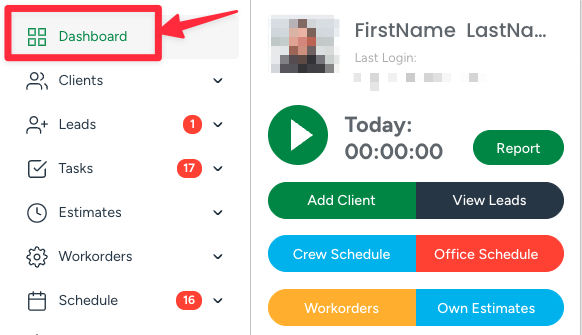
- Add Client: opens the page to create a new client profile;
- Crew Schedule: opens the page to view or create new jobs for crews;
- Workorders: displays the workorders list, categorized by WO statuses;
- View Leads: opens the leads map, displaying them as pins;
- Office Schedule: allows you to view and manage tasks for office workers and set new appointments for estimators;
- Own Estimates: redirects you to the Own Estimates submodule.
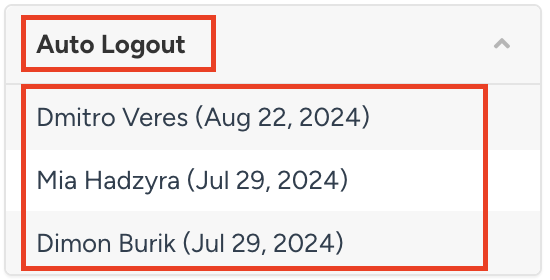
Under the Quick Access tab, the following information is displayed:
- The list of auto-logged users;
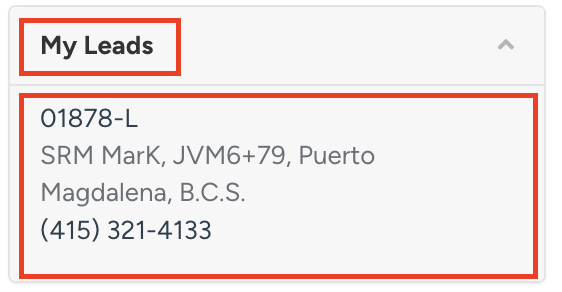
- Leads with the New status assigned to the currently logged-in user;
- Tasks with the New status assigned to the currently logged-in user;
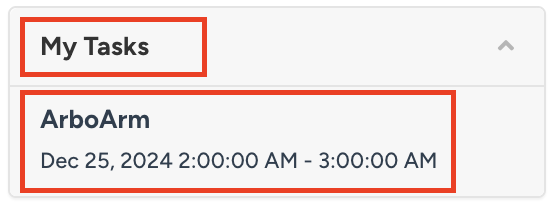
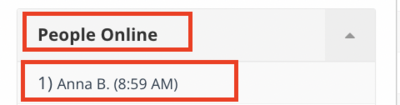
- Users who are currently online.
To-do List
From the Dashboard, Users can set up tasks for themselves or other users. To start creating the Task, navigate to Dashboard → Click the + button on the right-side To-Do List panel.
Clicking the + button shows a section for the new task, where users can add the description, and set the task as urgent.
Task section example:
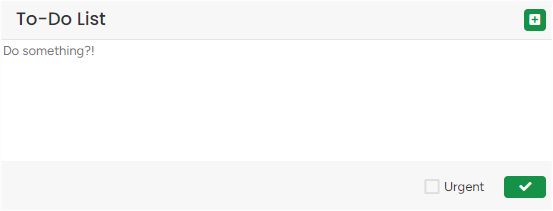
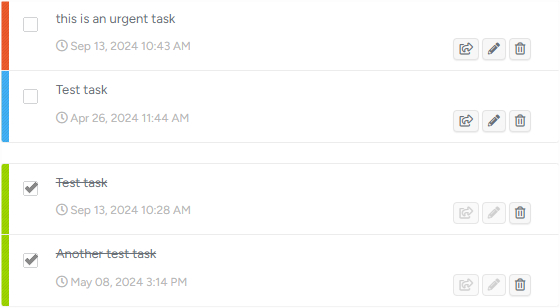
Clicking the green checkmark button creates a new task. Setting a checkmark next to Urgent makes the task urgent and outlines it with the red color line on the left.
Examples of urgent tasks, ordinary, and completed tasks:
- Clicking the Assign To field opens a drop-down where you can assign the Task to a particular User:
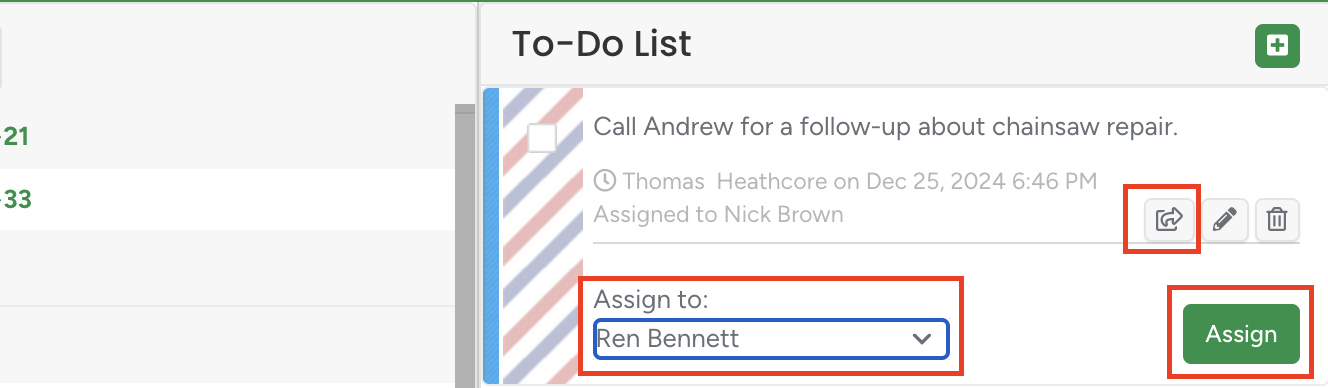
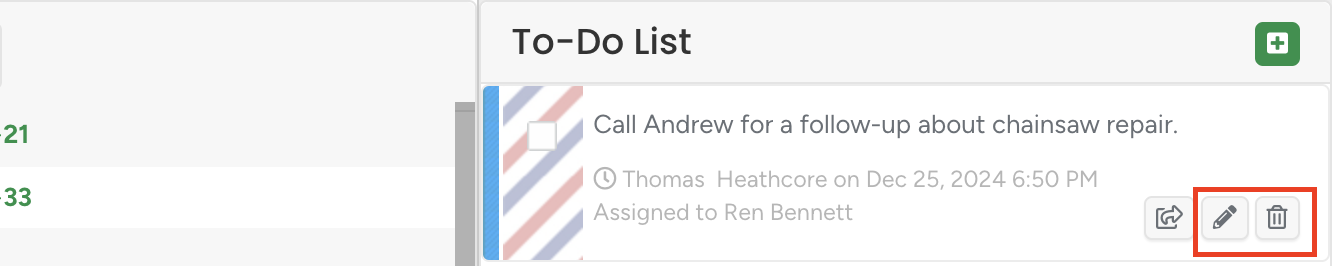
- You can edit or delete Tasks by clicking the Pencil or Bin icons, respectively.
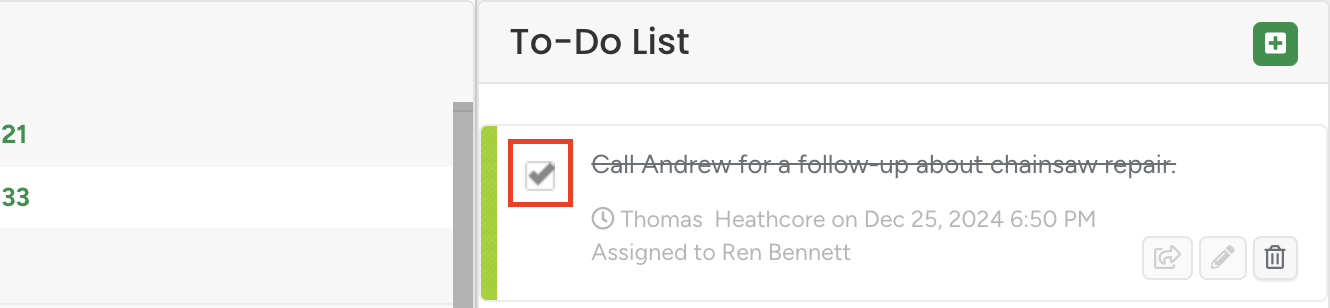
- Once the Task is completed, mark it as Done by ticking the checkbox.
Header-icons
In the header, several icons are available on every page of the system.
- Live search helps find clients, estimates, invoices, etc., with minimal information (e.g., first name letters or house number);

- To send or view the received SMS messages from clients, click the Phone icon.
Note that the SMS feature is integrated separately. Please contact us to learn more.

- To access the integrated messenger and communicate with your team members, click on the Message icon.
Please note that the messenger is available both on the web and app versions of ArboStar.

- Click on the user name to access sections like User Management, Company Management, Brands, or Forms sections.
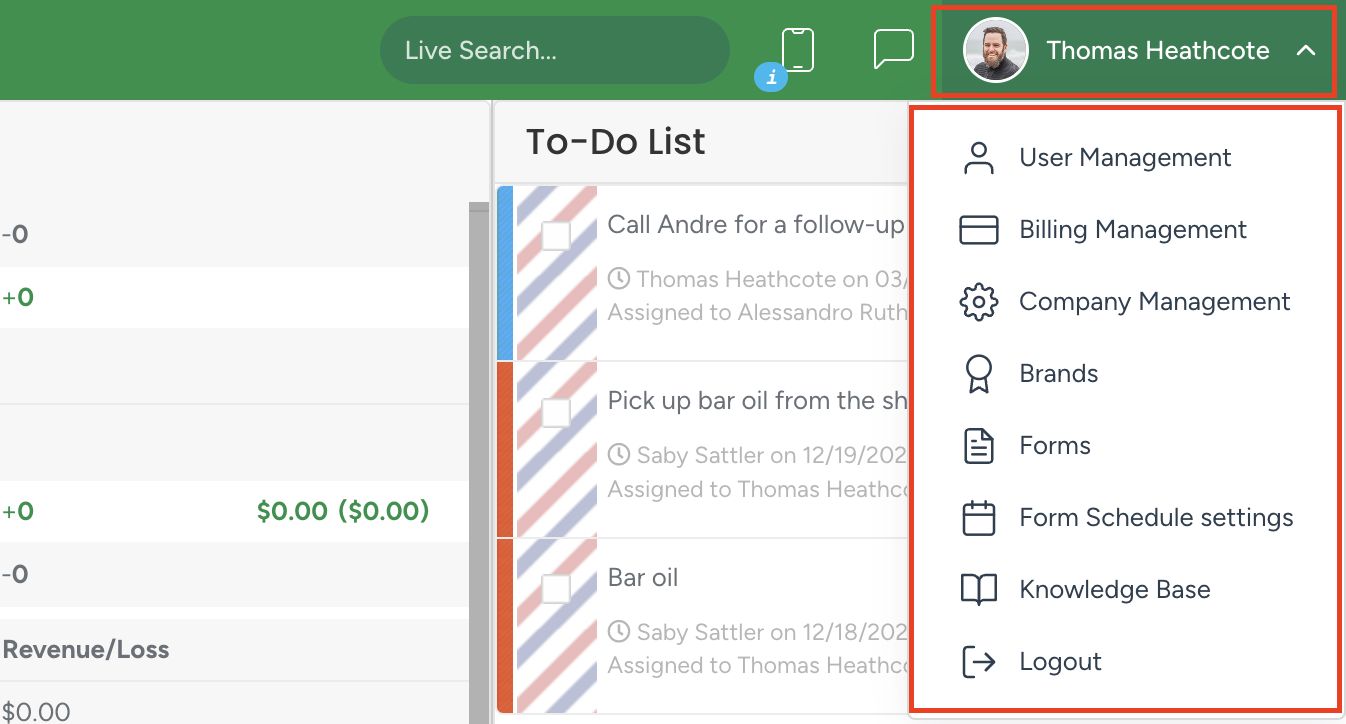
Note that these sections are available to the admin type of users.On the other hand the Knowledge base is accessible by all users.
Clock In / Clock Out
Below your username, you can find the Report button to access the clock-in menu. You can also start the time tracker directly from the Dashboard using the Play button.
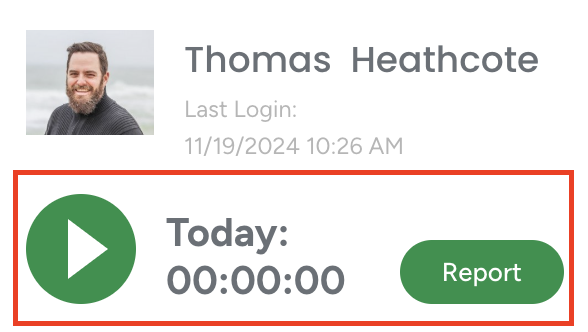
Click here to learn more about Clock In/Clock Out.
Productivity Pulse
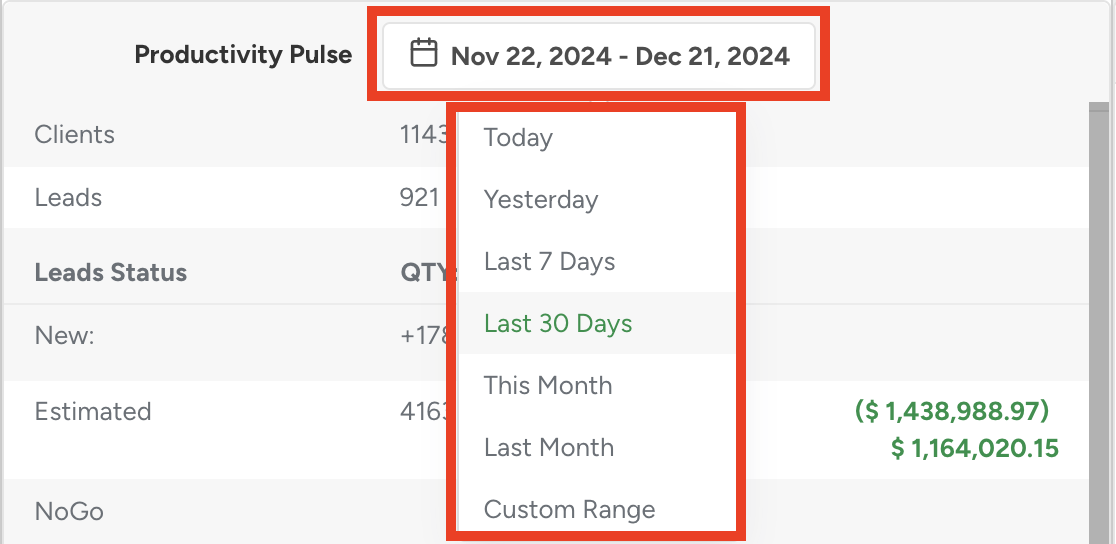
The Productivity Pulse section in the center of the page provides real-time insights into key business metrics for the current day. You can adjust the time range using the calendar to view specific data. The information is divided into sections such as reports, clients, leads, estimates, work orders, and invoices.
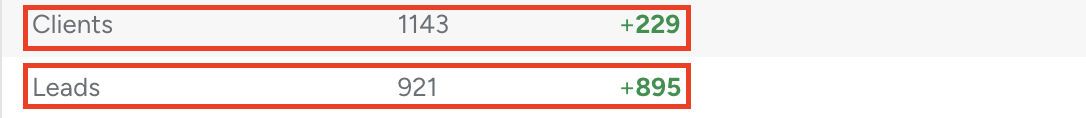
In the first section, you can find insights about clients and leads:
The Clients row:
- Displays the total number of clients up to the selected date and the number of new clients added within the chosen period. Click on the number, to see the list of newly created clients and access their profiles.
The Leads row:
- Displays the total number of leads up to the selected date. Click on the number, to see the list of newly created leads and their respective creators.
The following section shows detailed information about Leads separated by their statuses. It displays the total number of leads and new leads added within the period.
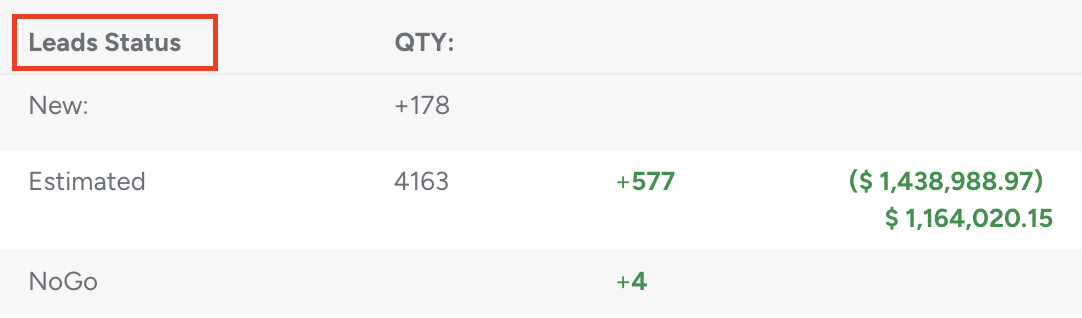
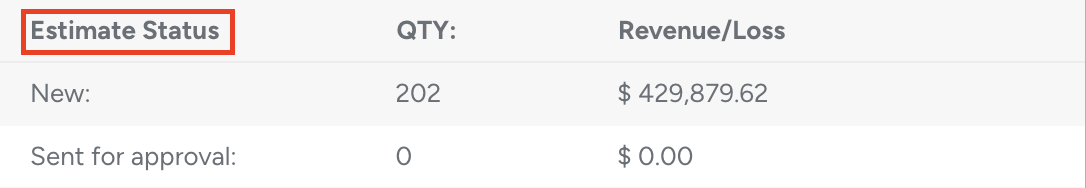
The next section is all about Estimates. It shows the total number of estimates divided by statuses (e.g., new, sent for approval, pending, confirmed, declined, expired) and revenue or loss associated with each of those statuses.
The Workorders row shows how many WOs the company has up to the date indicated on the calendar and their cost.

The Invoices row shows the number and cost of invoices.

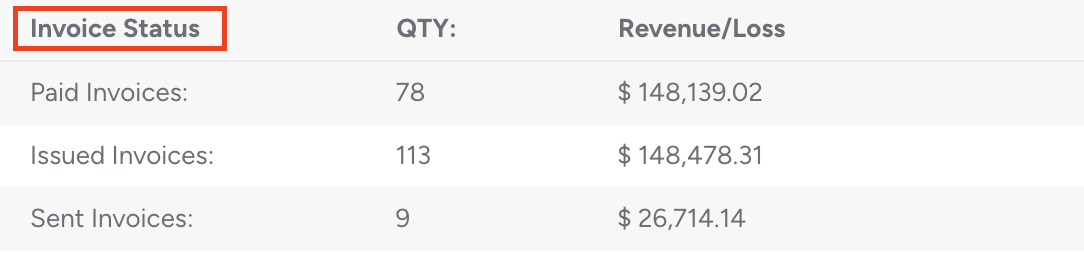
The next section shows detailed information about Invoices separated by their statuses. Here you can see how many invoices have been issued, sent, and paid, and how many overdue or holdback invoices there are. It also displays the revenue or loss associated with each invoice status.