Review Comprehensive Invoice Breakdowns
The Invoices Summary section gives you an in-depth breakdown of the invoices, either across all time or within a specific date range.
Invoice data is categorized by status, allowing you to easily identify which stage each invoice is in—whether pending, paid, or overdue. You’ll also see the quantity associated with each status, helping you determine appropriate follow-up actions when needed.
- To access this section, go to Business Intelligence → Invoices → Invoices Summary.
To filter results by date, click the Date field and either choose a preset range or customize the period to suit your needs.
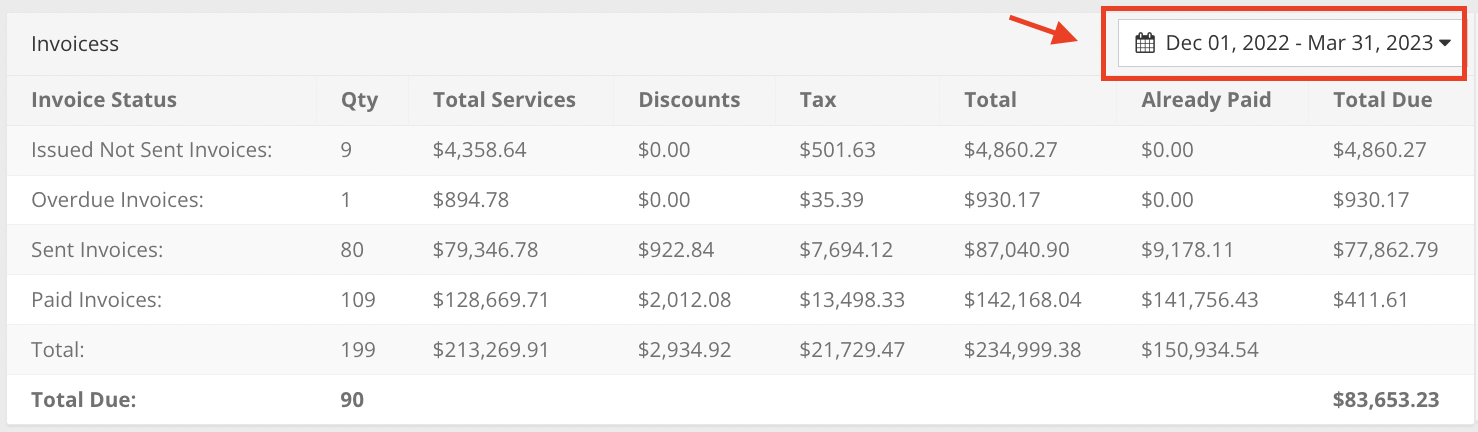
In the Invoices list, you can see the detailed breakdown for each invoice status:
- In the Qty column, you can see how many invoices exist in the system with each status for the chosen time range.
- In the Total services, you get the information about the total sum of services for each status for the chosen time range.
- If any of the services were discounted, you can see the discount amount for each status in the Discounts column.
- In the Tax column, you get the average sum of the tax % for each invoice status.
- The Total column provides the sum for each invoice status that includes the tax and discount.
- In the Already Paid column, you can see the sum that has already been paid for each status.
- Total Due column shows the remaining amount that needs to be paid for each status.
- The Total Due shows the total quantity of invoices that exist in the system for the chosen time range, as well as the total amount that still needs to be paid for all the statuses combined.
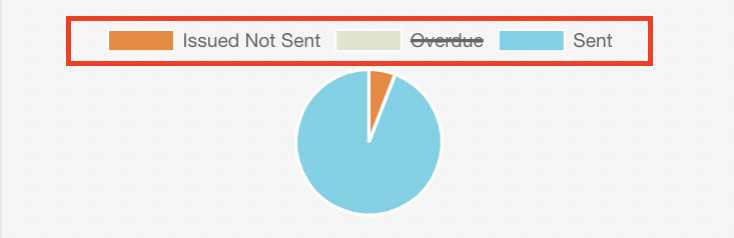
Next to the list, a pie chart visually represents the data for easier interpretation. To enable or disable a specific status in the chart, simply click the colored box next to the corresponding status label.
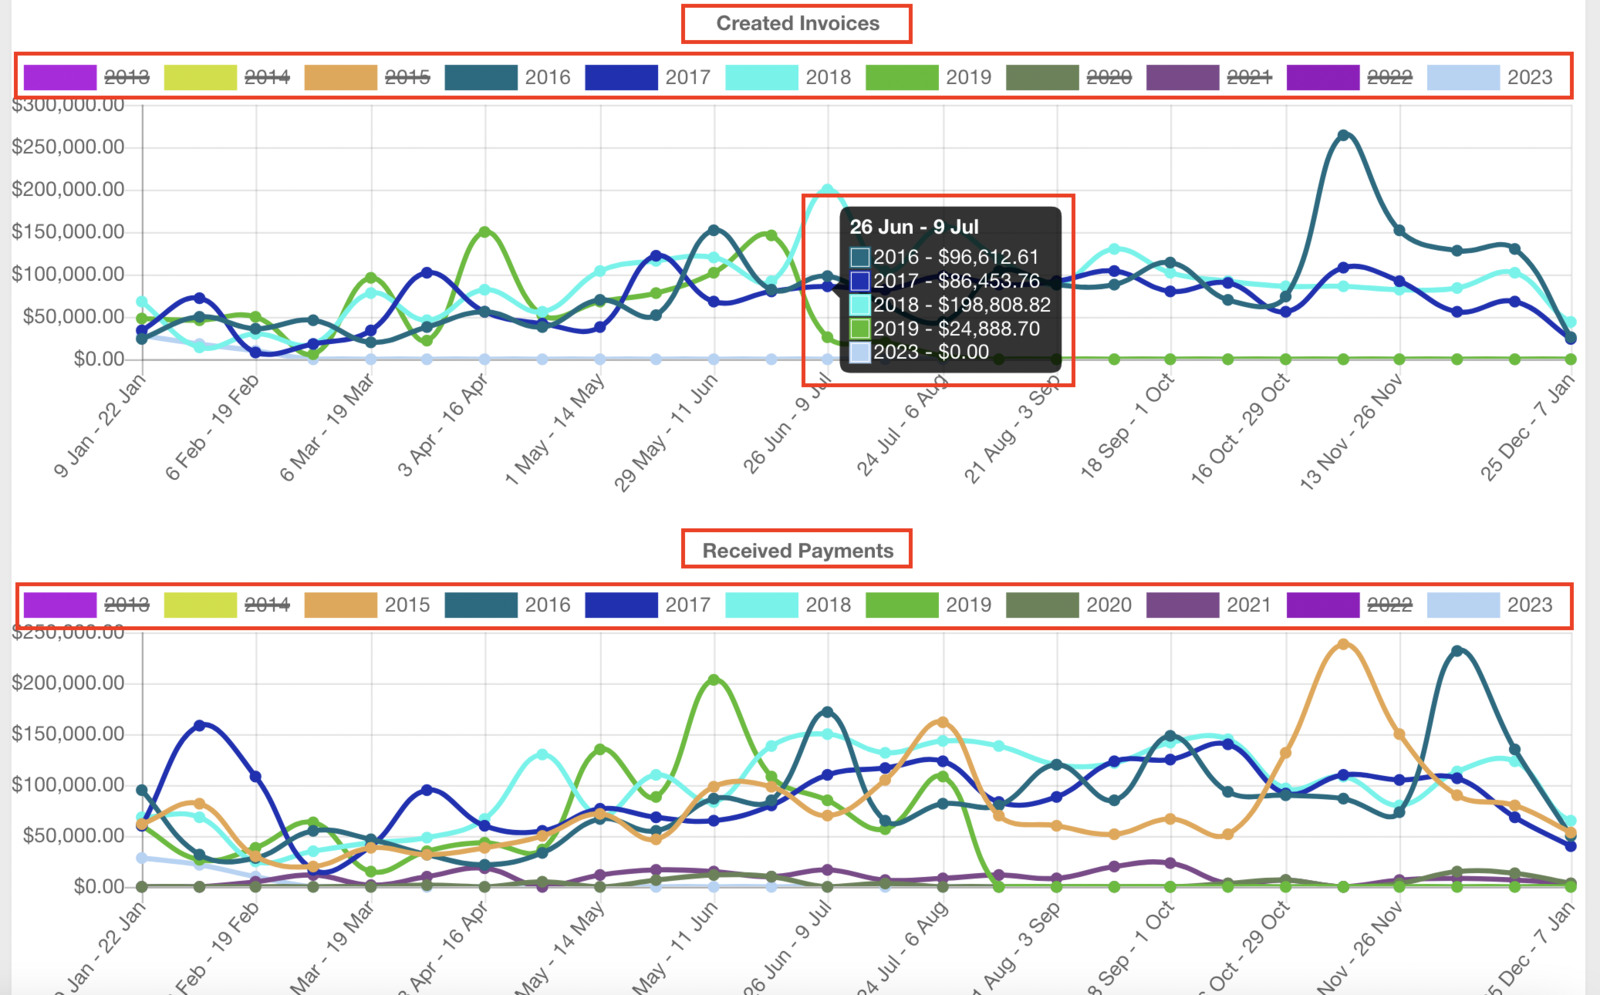
Below, you'll find two graphs:
The first graph displays statistics for all created invoices.
The second graph presents data on all received payments.
To show or hide a specific year in the graphs, click the colored box next to the corresponding year. Hover over any point on the graph to view detailed sums for a specific period.