
Estimator KPI Overview
The Estimates Reports section provides detailed insights into estimates, organized by their current status. This submodule allows you to view the total number of estimates created, assess the associated revenue or potential loss, and analyze estimator performance.
It also offers visibility into how efficiently estimates are being executed and how long it takes for them to progress into work orders, giving you a better understanding of your sales pipeline.
- To access this report, go to Business Intelligence → Estimates → Estimates Reports
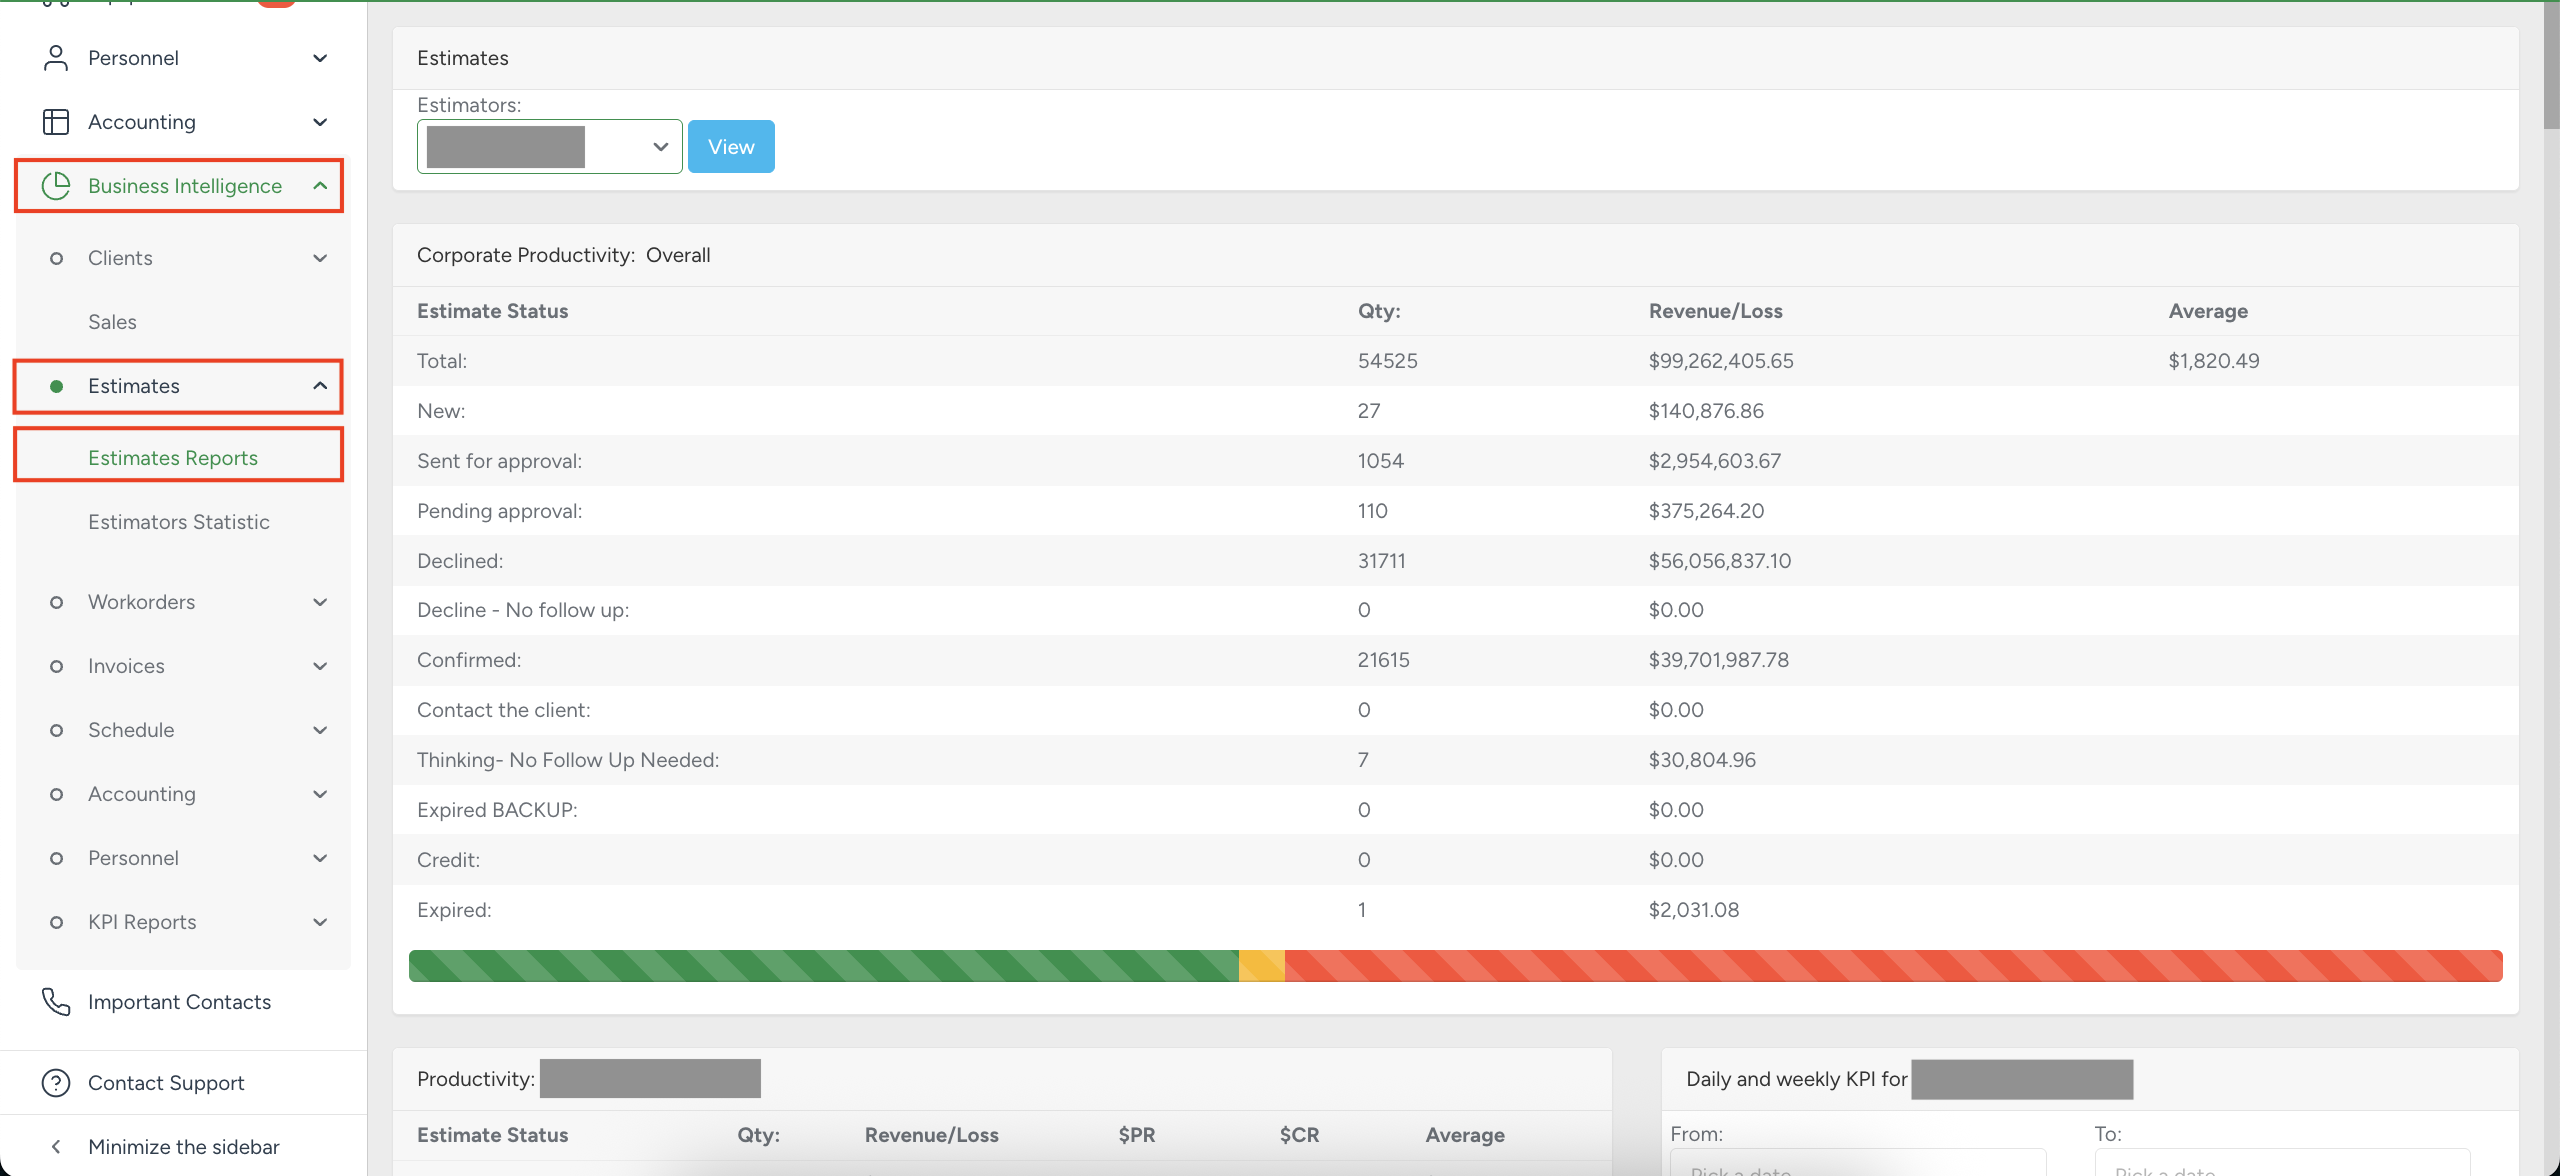
The report provides statistics for all time periods (or a selected range), including:
Estimate status — total number and breakdown by each status.
Quantity — how many estimates fall into each category.
Revenue / Loss — confirmed value vs. declined or canceled.
Average $ — average estimate value per estimator.
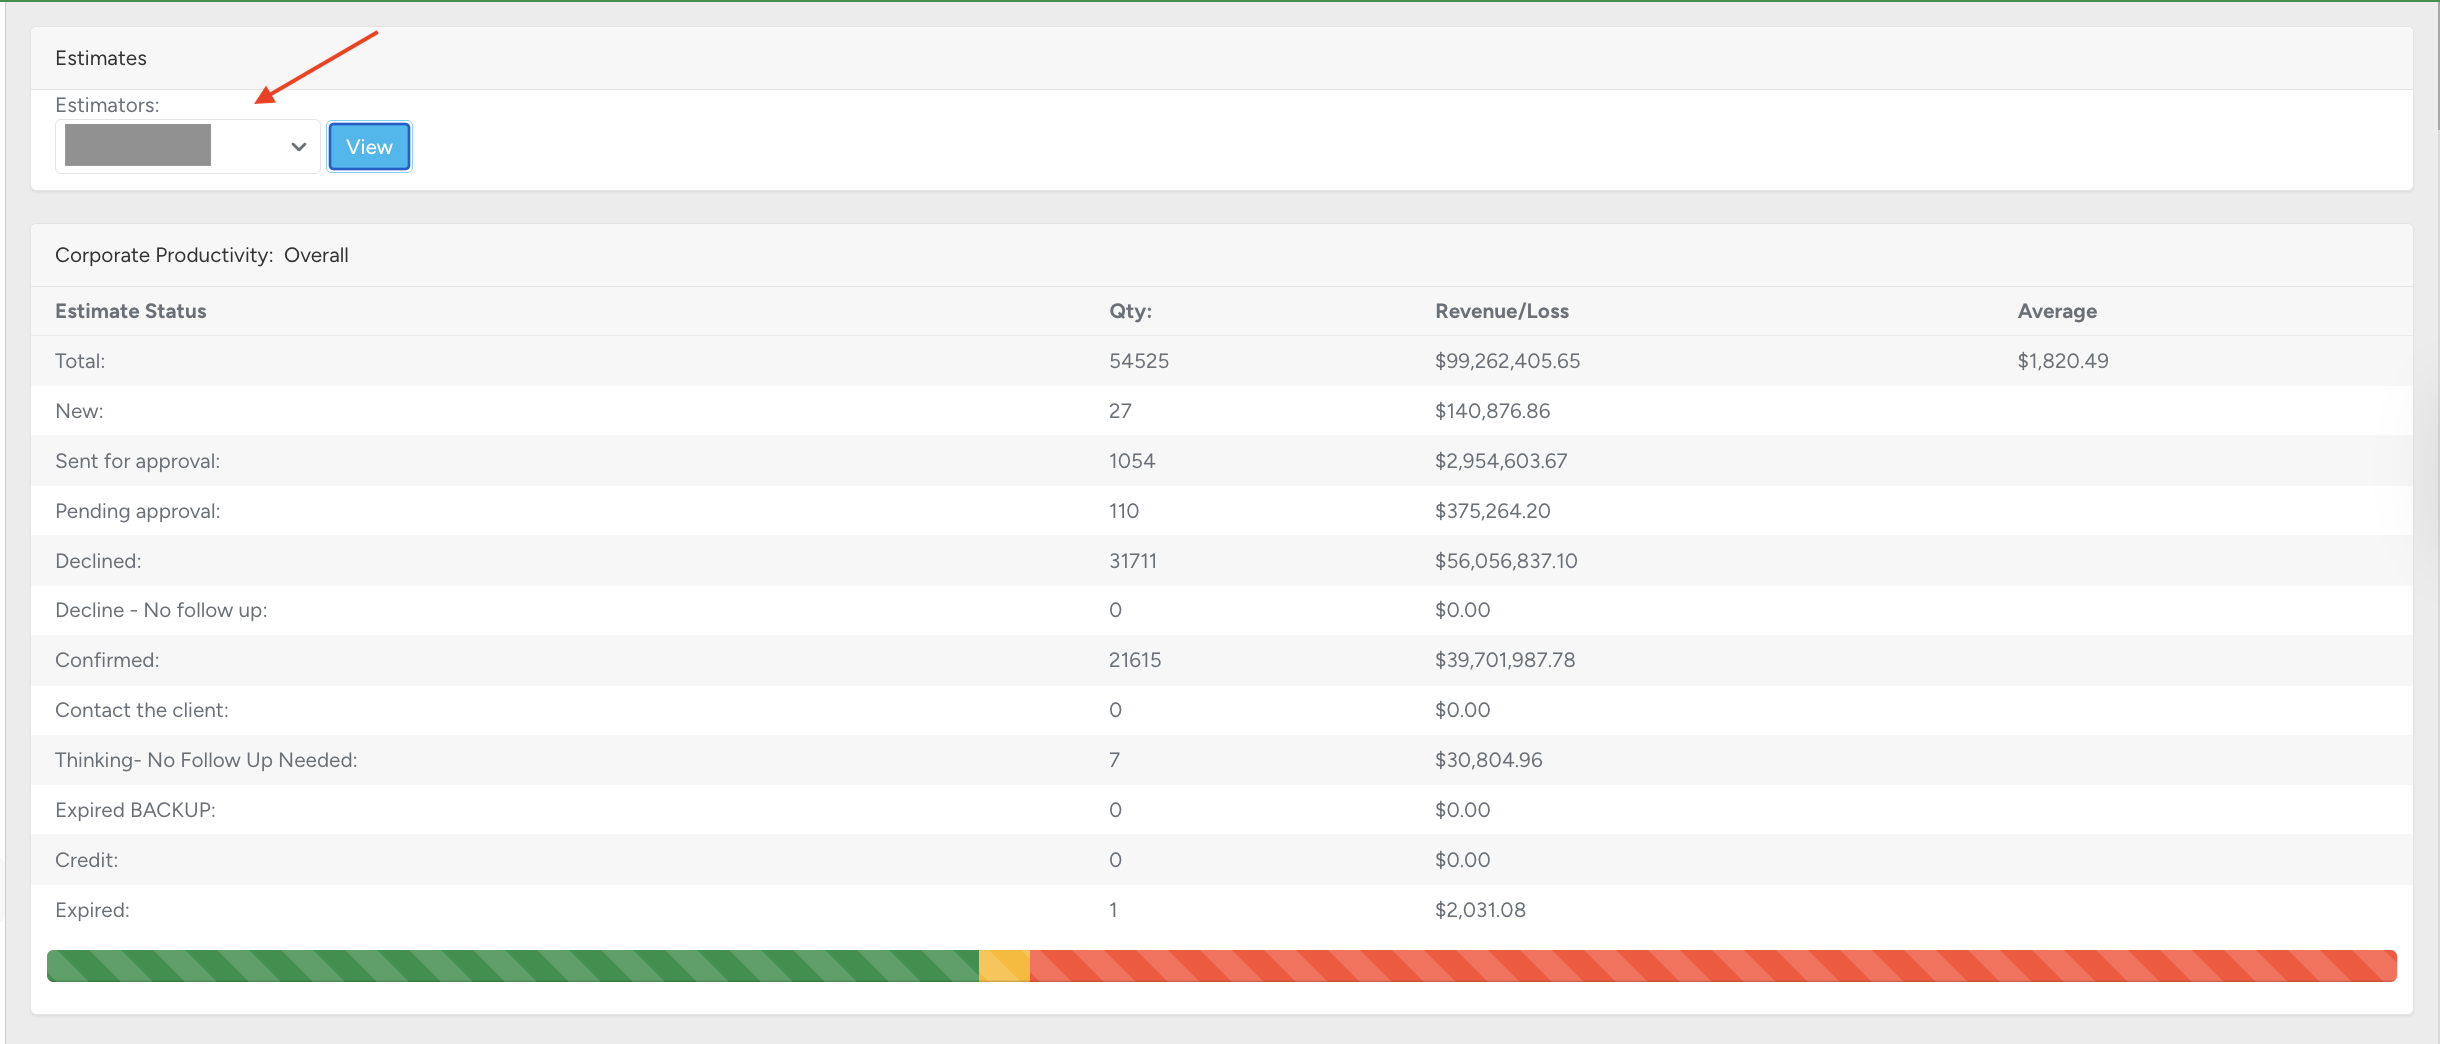
How the data is organized
The data is grouped by estimator. To view performance for a specific estimator, click the Estimators field, select the desired name from the drop-down list, and click the View button.
Once an estimator is selected, all data in the report is filtered and displayed specifically for that individual.
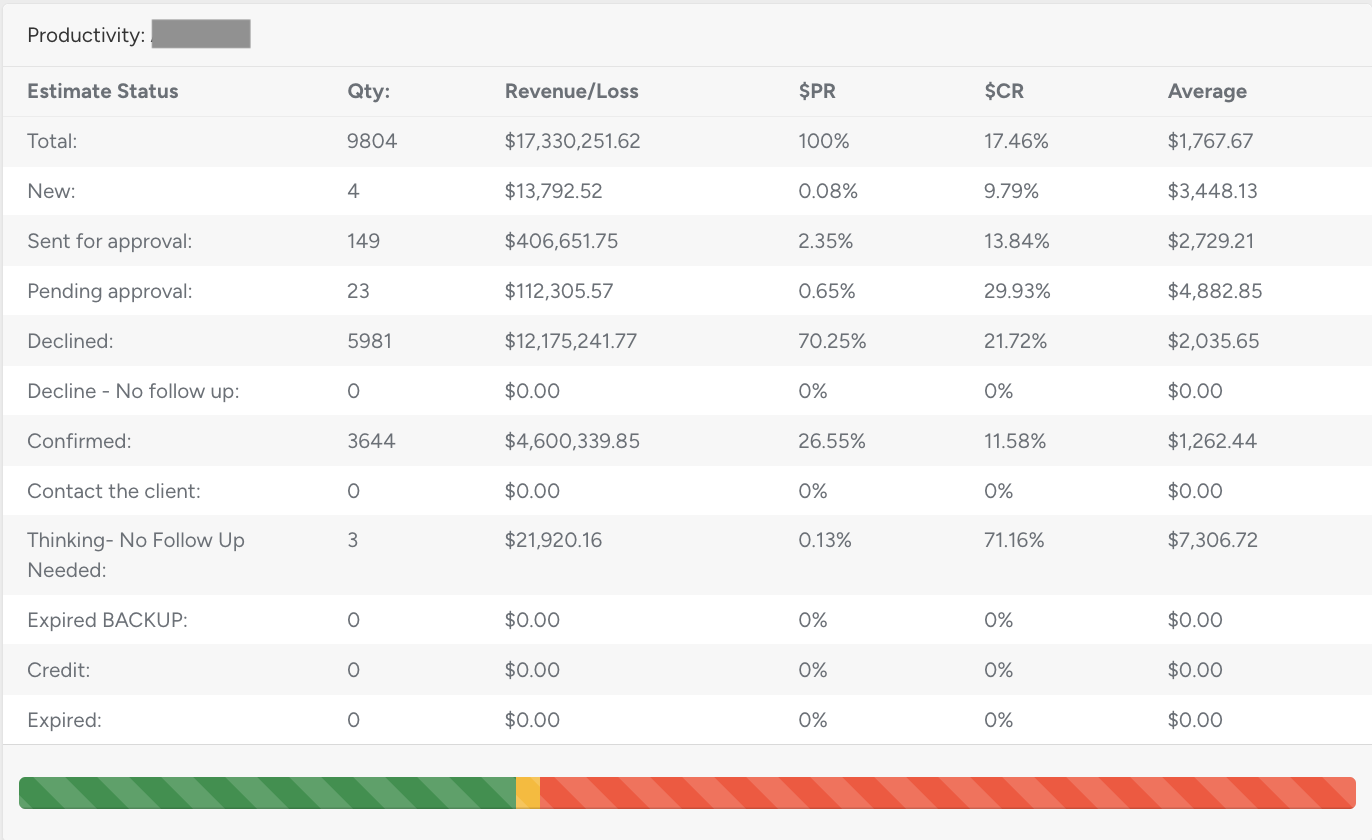
Estimator's Productivity
The Productivity section highlights key performance metrics grouped by columns:
Estimate Status — includes the total row followed by a detailed breakdown of each status.
Quantity — number of estimates associated with each status.
Revenue / Loss — financial outcome of confirmed versus declined estimates.
$PR (Personal Rate) — individual estimator’s return rate.
$CR (Company Rate) — company-wide return rate for comparison.
Average ($) — average estimate value expressed in currency.
Daily and Weekly KPI Reports
This report presents key performance metrics for the selected estimator within the defined period. The data is structured across three interconnected columns: estimate statuses, financial outcomes, and working days. Together, these indicators provide a comprehensive view of estimator efficiency and contribution.
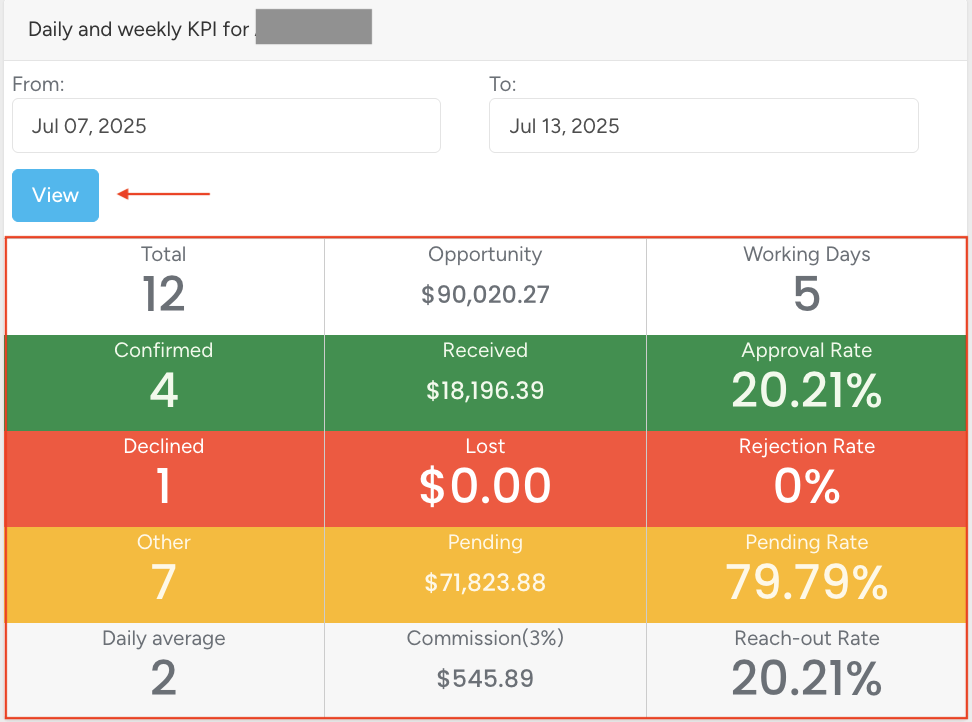
Column 1 — Estimate Statuses
Total — overall number of estimates created.
Confirmed — count of estimates approved by clients.
Declined — count of estimates rejected.
Other — estimates that remain pending or outside standard statuses.
Daily Average — average number of estimates generated per day.
Column 2 — Financial Indicators
Opportunity — total value of all estimates.
Received — revenue generated from confirmed estimates.
Lost — value of declined or canceled opportunities.
Pending — value of estimates awaiting client decision.
Commission (3%) — calculated commission based on confirmed revenue.
Column 3 — Efficiency Metrics
Working Days — number of active days within the selected period.
Approval Rate — share of confirmed estimates in relation to total.
Rejection Rate — share of declined estimates.
Pending Rate — share of opportunities still under consideration.
Reach-out Rate — proportion of confirmed opportunities against total.
By combining estimate statuses, financial results, and time indicators, the report delivers a complete overview of estimator productivity, revenue impact, and conversion efficiency within the selected timeframe.
Estimator's files
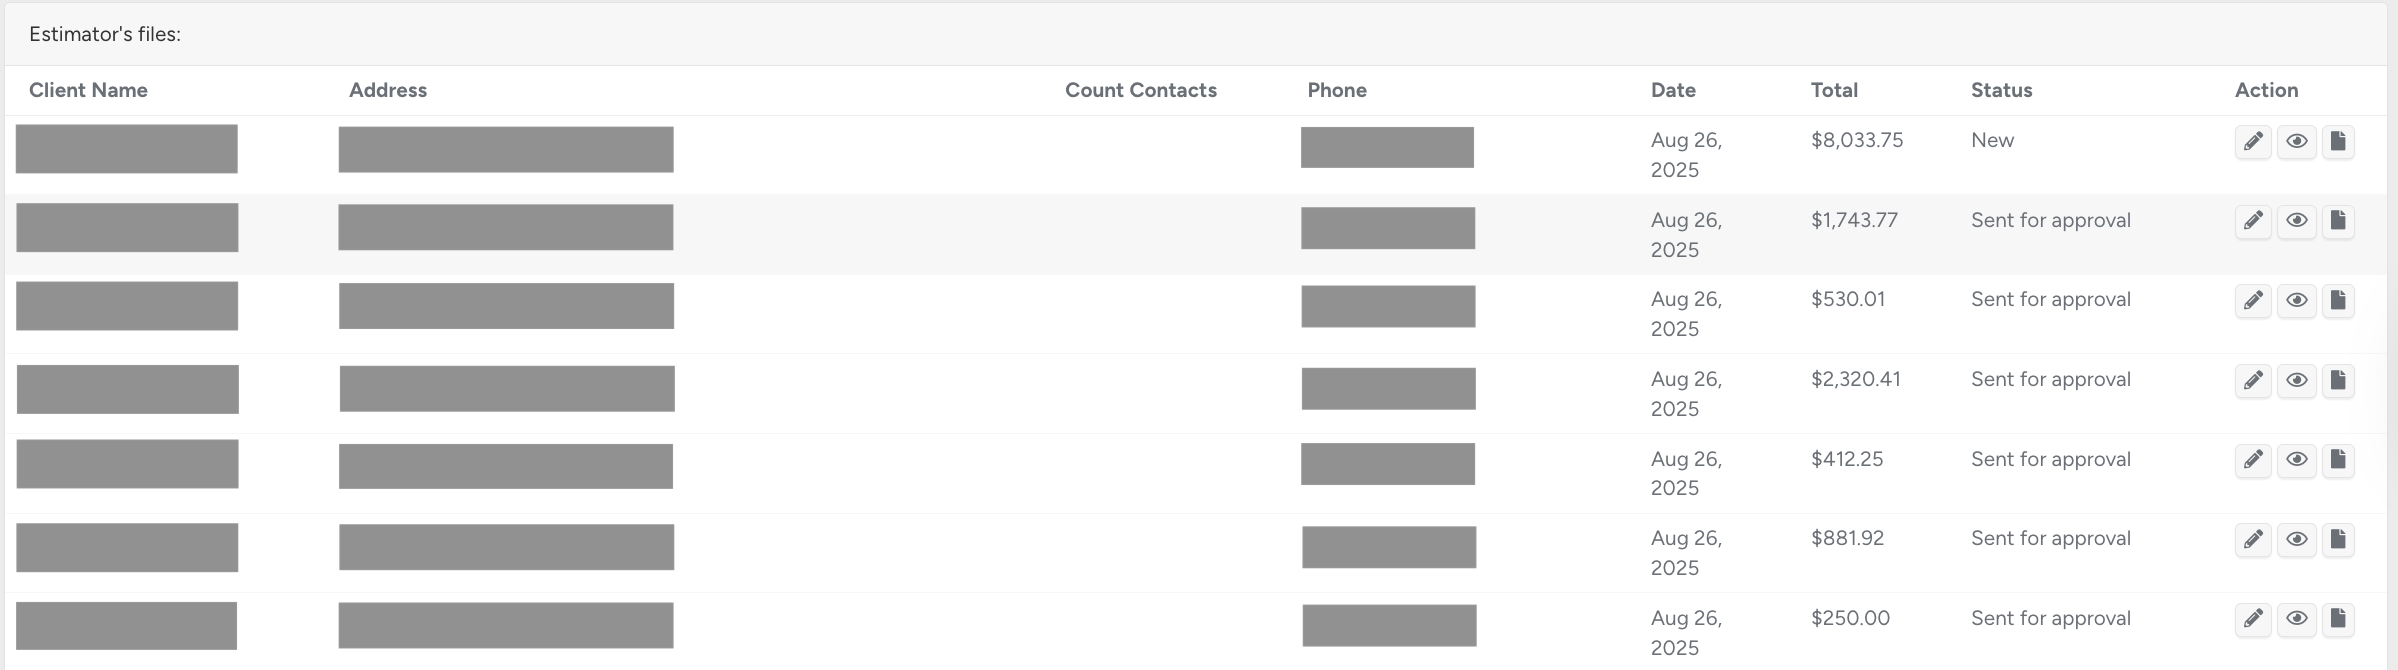
For each estimate, the following client and estimate details are available:
Client Name
Address
Count Contacts (number of contacts if more than one)
Phone
Date
Total Value (currency)
Status
Action: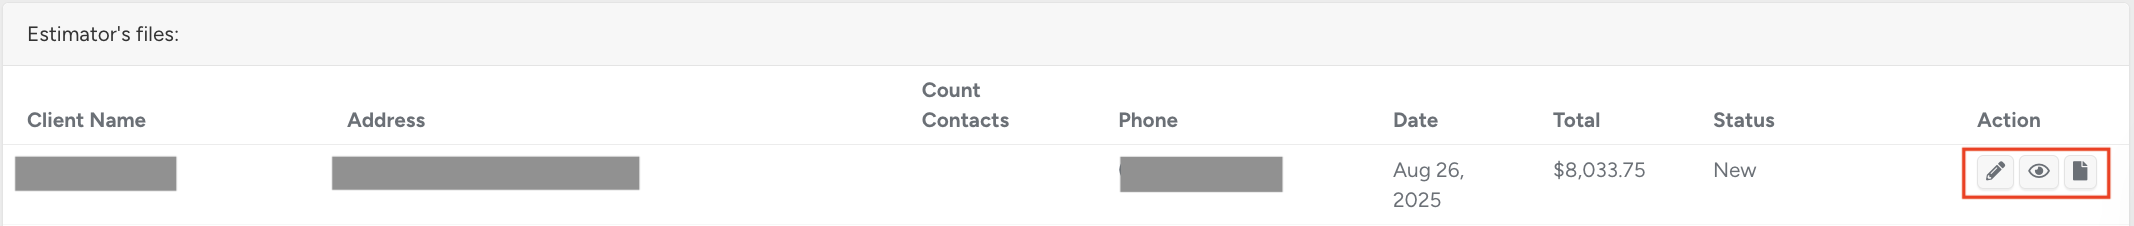
✏️ Pen — edit the estimate (redirects to editing in the client profile).
👁️ Eye — view the estimate (opens in the client profile, read-only).
📄 File — download the estimate as a PDF.
Days from estimate to workorder
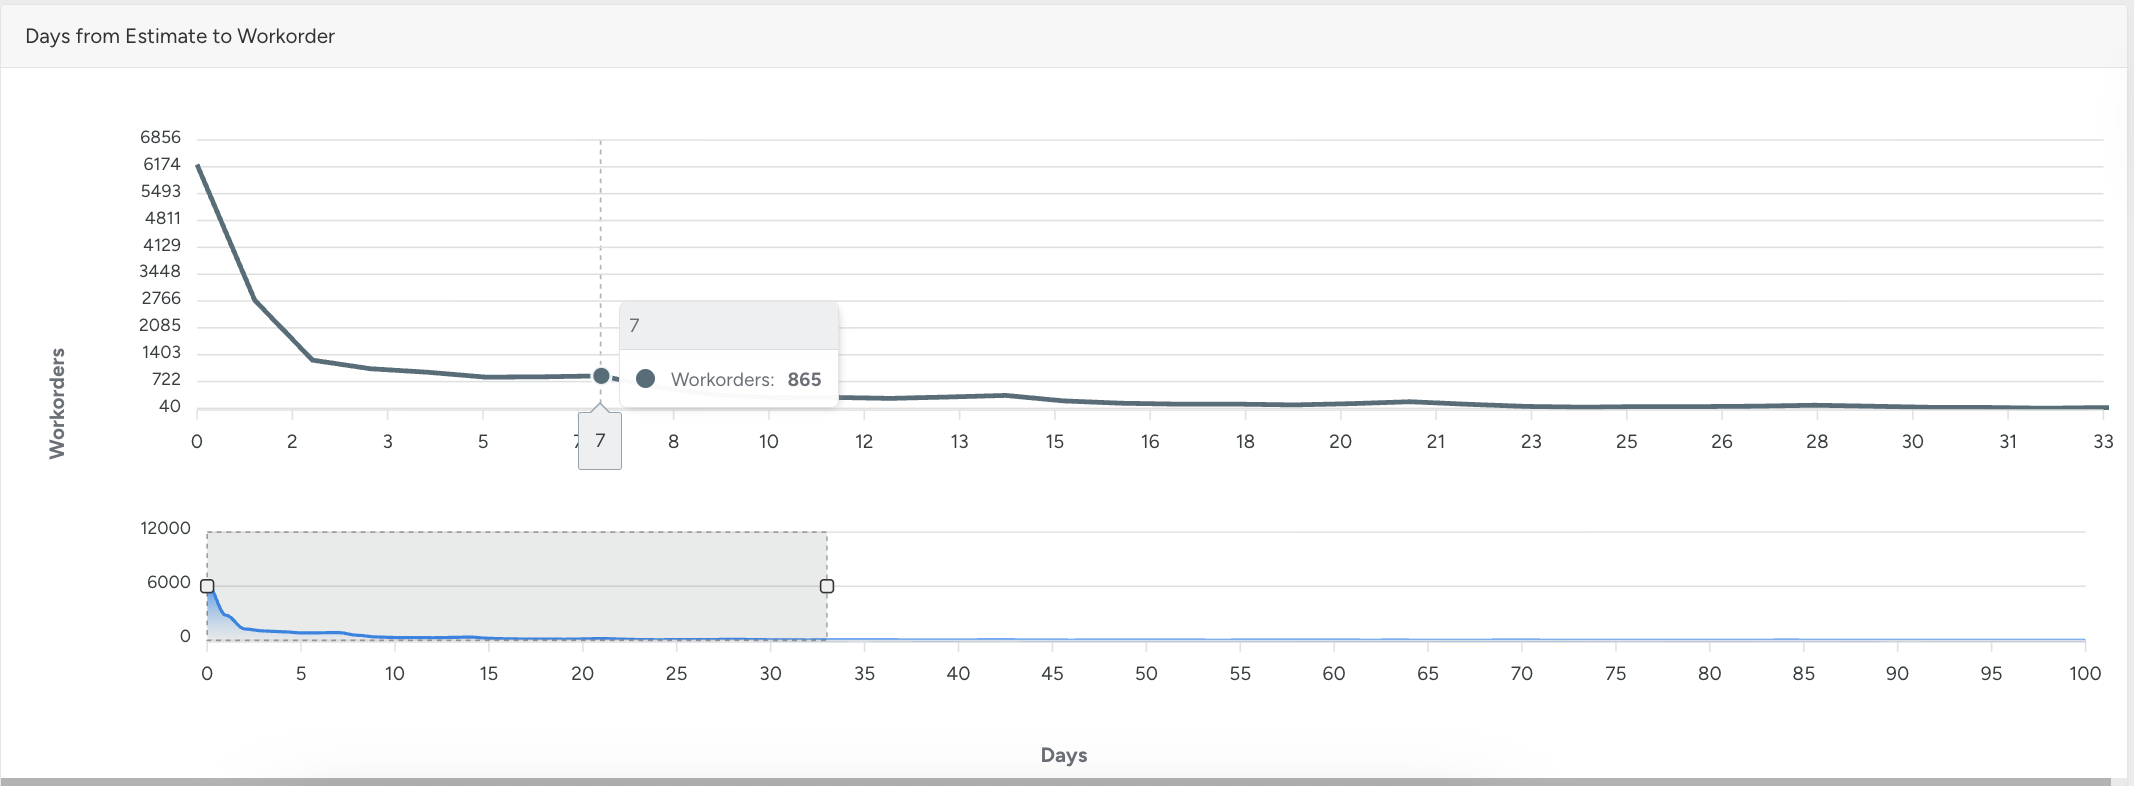
This chart provides a visual overview of the time elapsed between estimates and the corresponding workorders. The horizontal axis represents estimates, while the vertical axis indicates workorders.
The Days Filter below the chart allows changing the view to display different time ranges. This feature supports analysis of time intervals for various periods, helping to monitor workflow efficiency and identify opportunities for process optimization.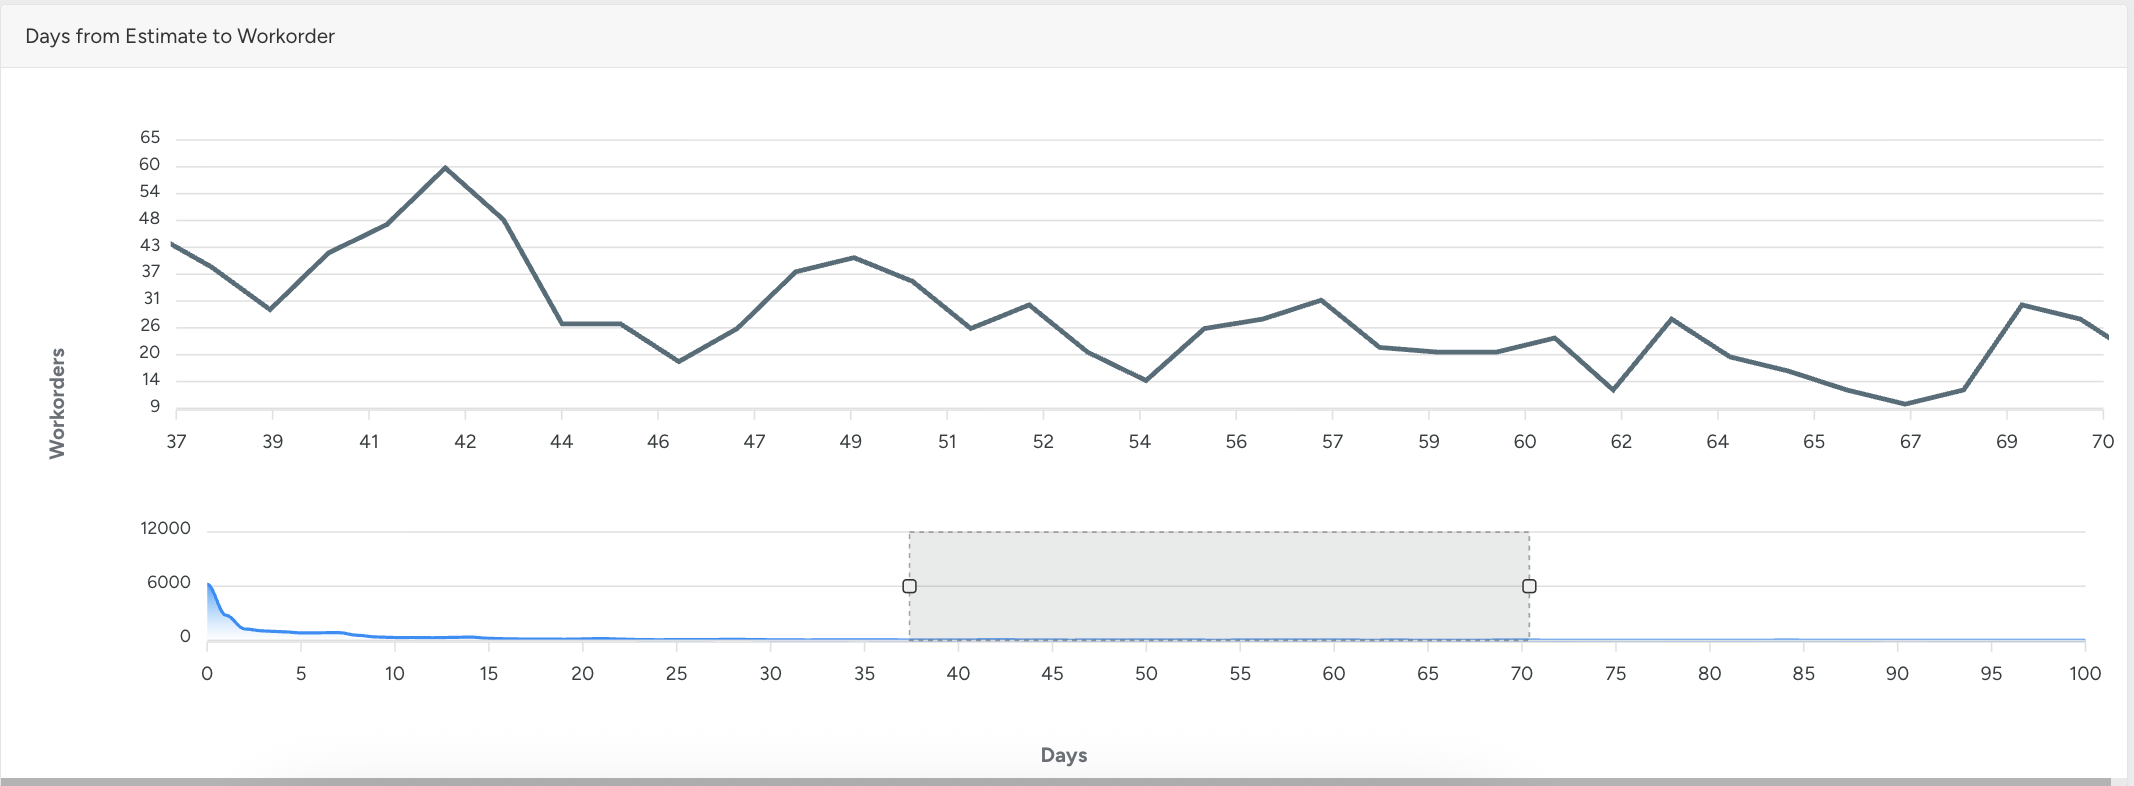
The Estimator KPI Overview consolidates all critical metrics related to estimates, workorders, and estimator performance. It enables efficient monitoring of productivity, financial outcomes, and workflow timelines, supporting data-driven decision-making and process optimization. By providing visibility into estimate conversion, revenue impact, and operational efficiency, the report helps management identify trends, improve estimator performance, and ensure the timely delivery of services.