
The KPI Reports are designed to support better decision-making by offering targeted insights into invoice aging, income flow, and other revenue-related metrics.
The KPI Reports module is enabled by default. If you’d like to request deactivation, please contact our support team.
- Once activated, navigate to Business Intelligence → KPI Reports to access the submodule.
The Overview submodule provides a high-level snapshot of your most important financial and sales indicators. It’s ideal for quick check-ins or leadership meetings when you need a clear summary without diving into detailed reports.
It consists of 8 key sections:
New Leads – Tracks newly created leads within the selected period
New Estimates – Shows the total value of estimates created
Sales Won – Displays the value of confirmed estimates
Revenue (Completed) – Shows revenue totals from completed services
Revenue (In Progress) – Displays income tied to services currently underway
Revenue (Backlog) – Shows the total value of approved services that haven’t started yet and are waiting to be completed
A/R Aging – Displays open invoice balances with aging breakdowns by overdue periods
Estimator Sales – Summarizes key performance metrics for each estimator
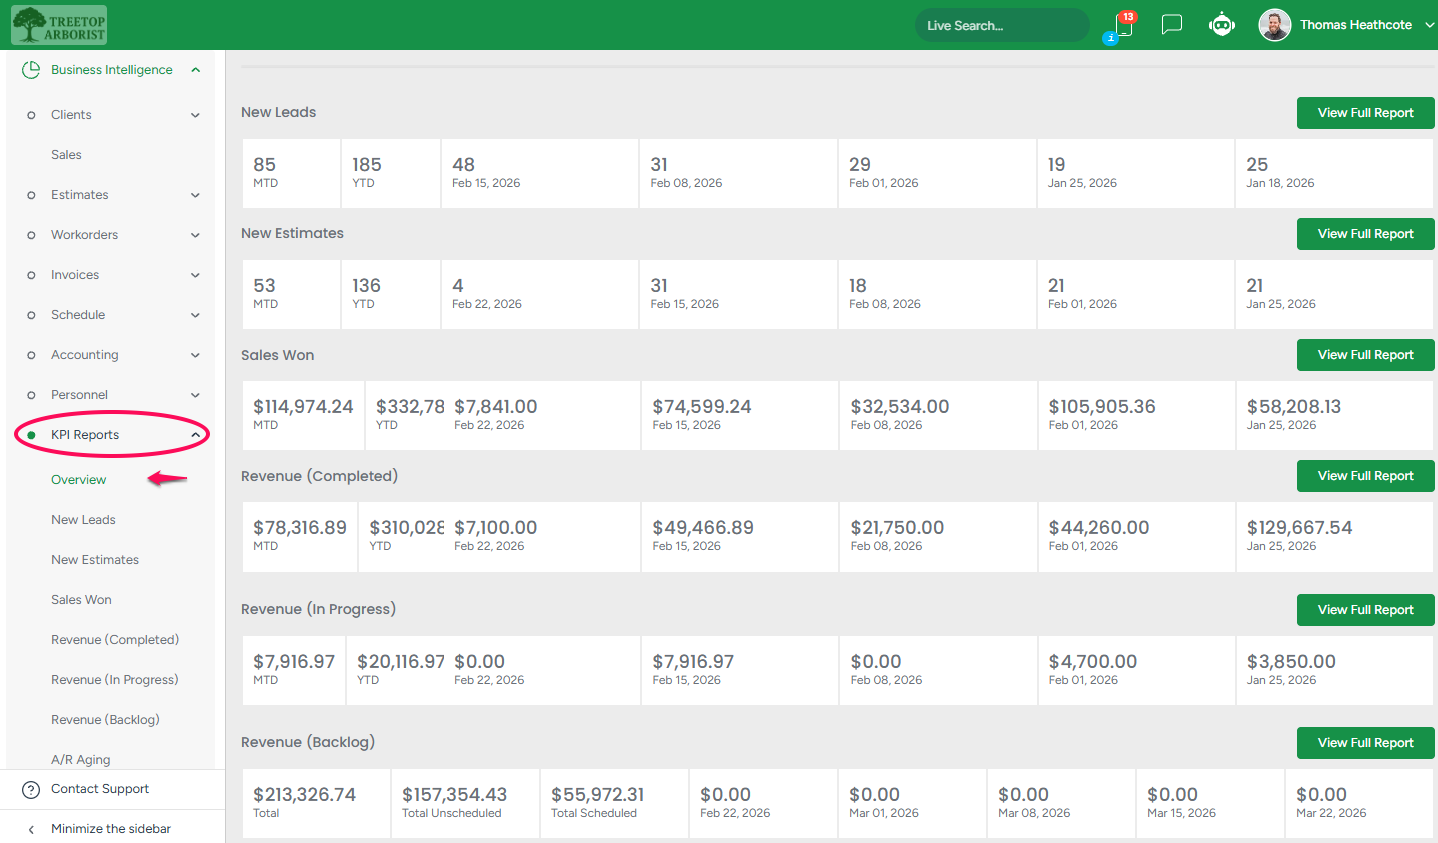
Each section shows the sum of the services for the last five weeks and the amounts for the current month (MTD) and the current year (YTD)
- To dive deeper into any of these data sets, click the View Full Report button next to the respective KPI section or use the sidebar to access its full submodule.
New Leads
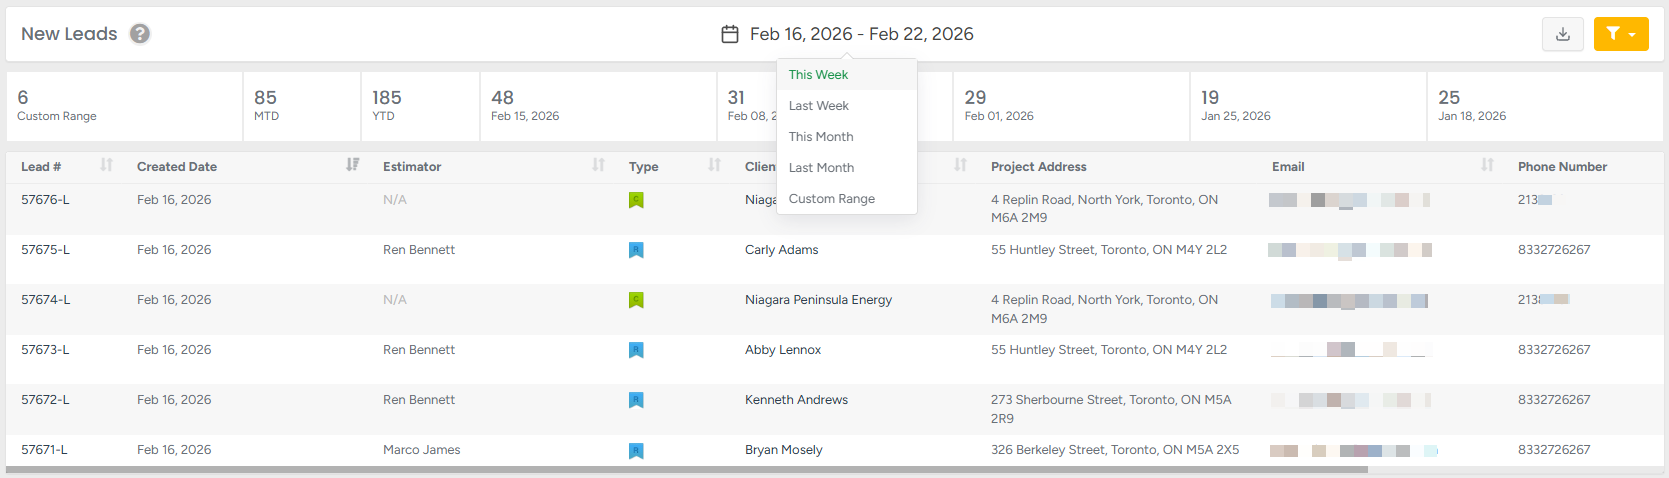
The New Leads section displays all leads created within the selected date range, along with key client and contact details. This report helps monitor lead generation activity over time and provides insights into how new business opportunities are coming in.
To access this section, go to:
Business Intelligence → KPI Reports → New Leads
- Click the calendar icon to select the desired date range.
- Press the Download button to export the lead report in CSV format.
- Apply the Filter to display results for one or multiple estimators.
- Click the arrow icon to change the sorting order. This option is available only in the columns where the arrow is displayed
Dashboard report

MTD - displays the quantity of leads for the current (not filtered, just current/today's) month
YTD - displays the quantity of leads for the current (not filtered, just current/today's) year
The next 5 sections of the bar after the MTD and YTD section are the previous 5 weeks from today's period.
Main Report
Columns :
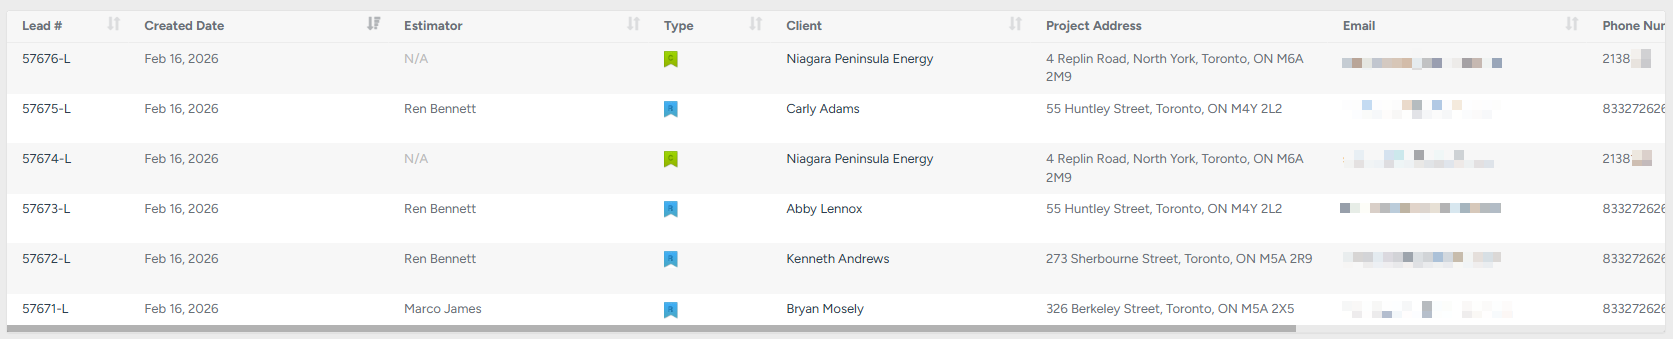
Lead # – unique lead number; click to open the client’s profile.
Created Date – the date when the lead was created.
Estimator – name of the assigned estimator.
Type – client type: residential, commercial, or municipal.
Client – client name; click to open the client’s profile.
Project Address – address of the client’s project.
Email – client’s email address.
Phone Number – client’s phone number.
Scroll horizontally to view additional columns.
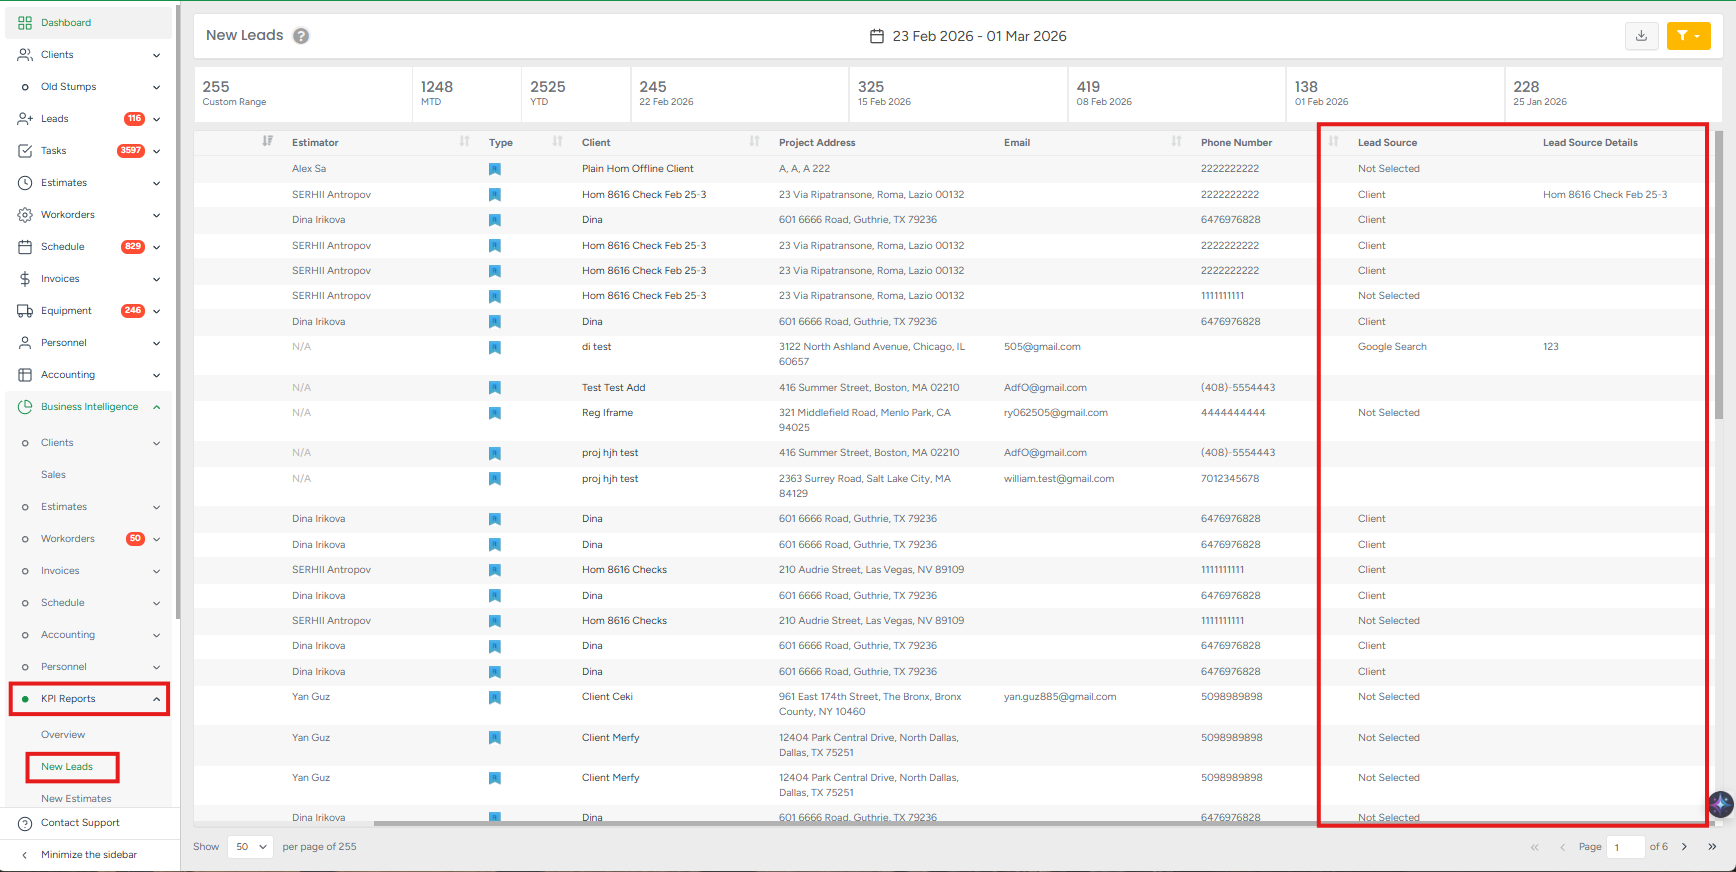
- Lead Source - shows how the client found out about your company.
The column includes:
Client name
Employee name
Custom entered referral text (if applicable)
This ensures full visibility and consistency in KPI reporting.
The New Leads report offers a clear overview of all incoming leads within a specific period, helping managers and estimators evaluate lead flow, track acquisition sources, and better understand the dynamics of new business generation. With export and filtering options, it ensures efficient monitoring and data-driven decision-making.
New Estimates
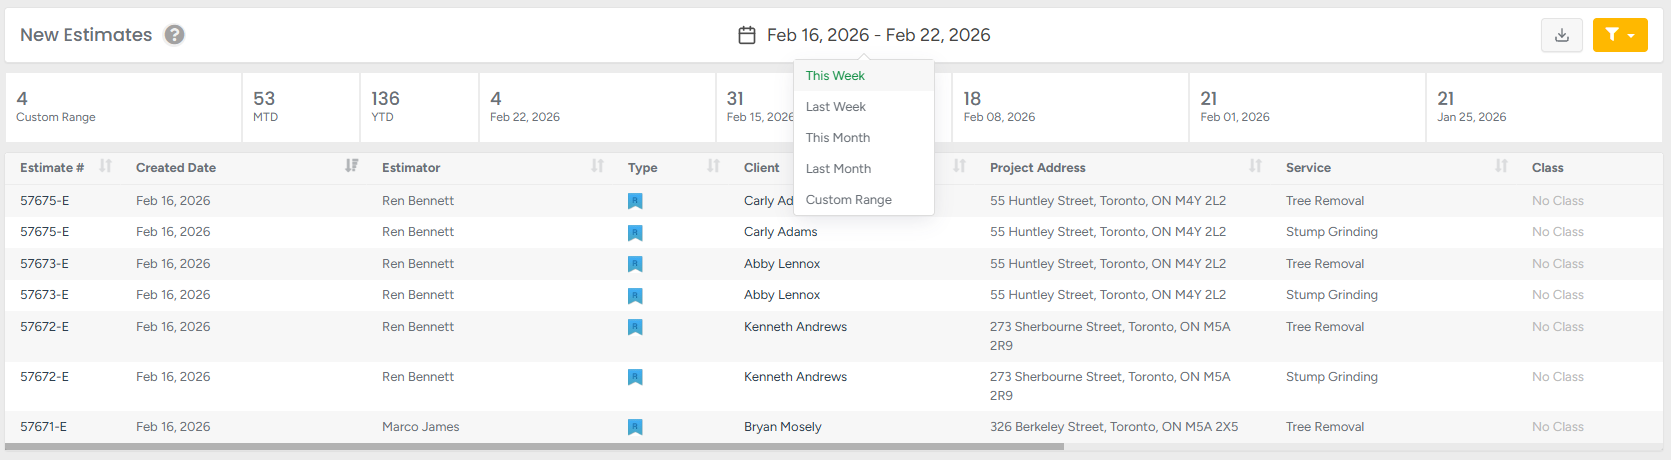
The New Estimates section displays all estimates created within the selected date range, along with their financial breakdowns. This report helps monitor estimating activity over time, giving insights into estimate volume, service types, discounts, and applied taxes. It’s a valuable tool for tracking trends in client proposals and overall sales performance.
To access this section, go to:
Business Intelligence → KPI Reports → New Estimates.
- Click the calendar icon to select the desired date range.
- Press the Download button to export the estimates report in CSV format.
- Apply the Filter to display results by:
Services / Products / Bundles
Classes
Estimators
Multiple options can be selected for each filter.Click the arrow icon to change the sorting order. This option is available only in the columns where the arrow is displayed
Dashboard report

MTD - displays the quantity of estimates for the current (not filtered, just current/today's) month
YTD - displays the quantity of estimates for the current (not filtered, just current/today's) year
The next 5 sections of the bar after the MTD and YTD section are the previous 5 weeks from today's period.
Main Report
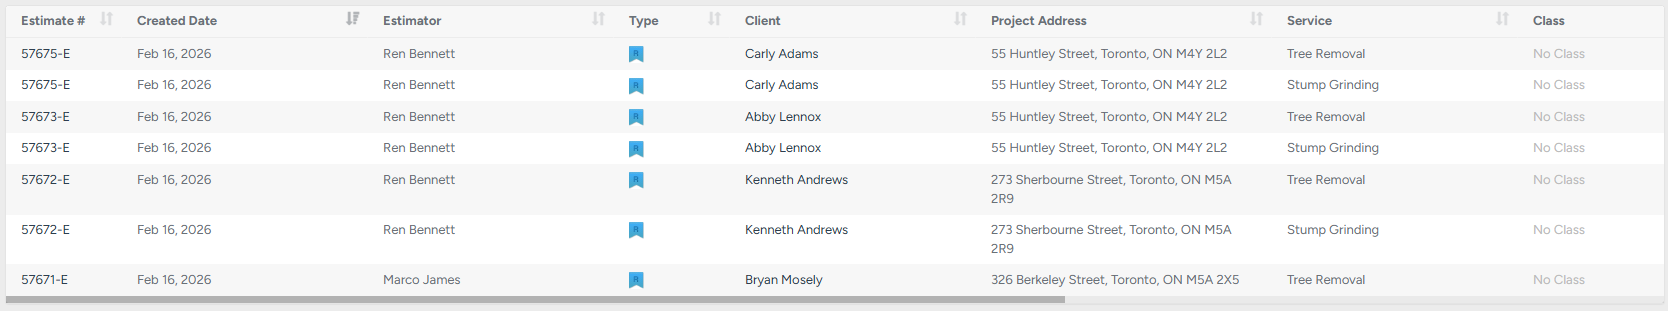
Columns :
Estimate # – unique estimate number; click to open the client’s profile.
Created Date – the date when the estimate was created.
Estimator – name of the assigned estimator.
Type – client type: residential, commercial, or municipal.
Client – client name; click to open the client’s profile.
Project Address – address of the client’s project.
Service – main service included in the estimate.
Class – class assigned to the estimate (if applicable).
Scroll horizontally to view additional columns.
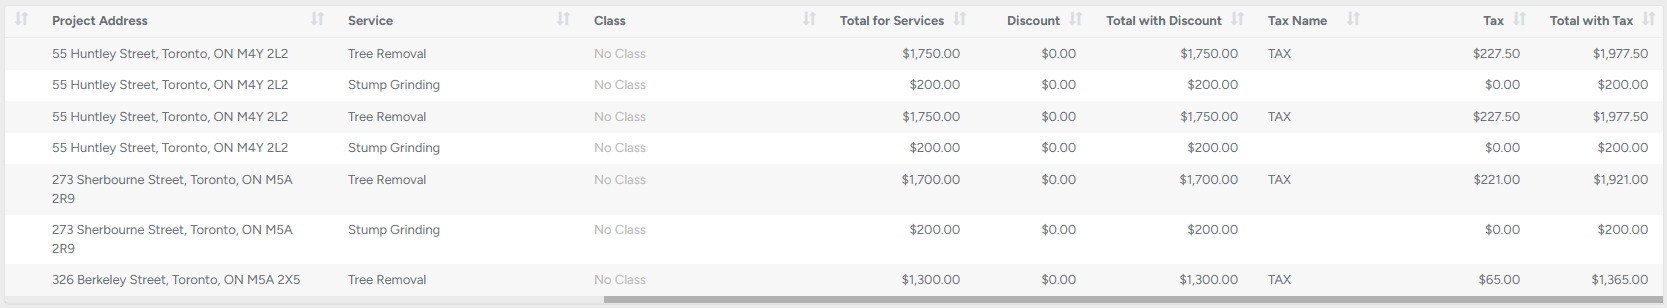
Total for Services – subtotal for all services included in the estimate.
Discount – applied discount amount.
Total with Discount – total after discount.
Tax Name – applied tax.
Tax – tax amount.
Total with Tax – final total including tax.
The New Estimates report provides a comprehensive overview of all estimates generated within a chosen time period. By analyzing volumes, financials, and service breakdowns, managers and estimators can track proposal activity, monitor revenue potential, and identify key sales trends. Export and filter options make this report an essential tool for strategic decision-making and performance analysis.
Sales Won
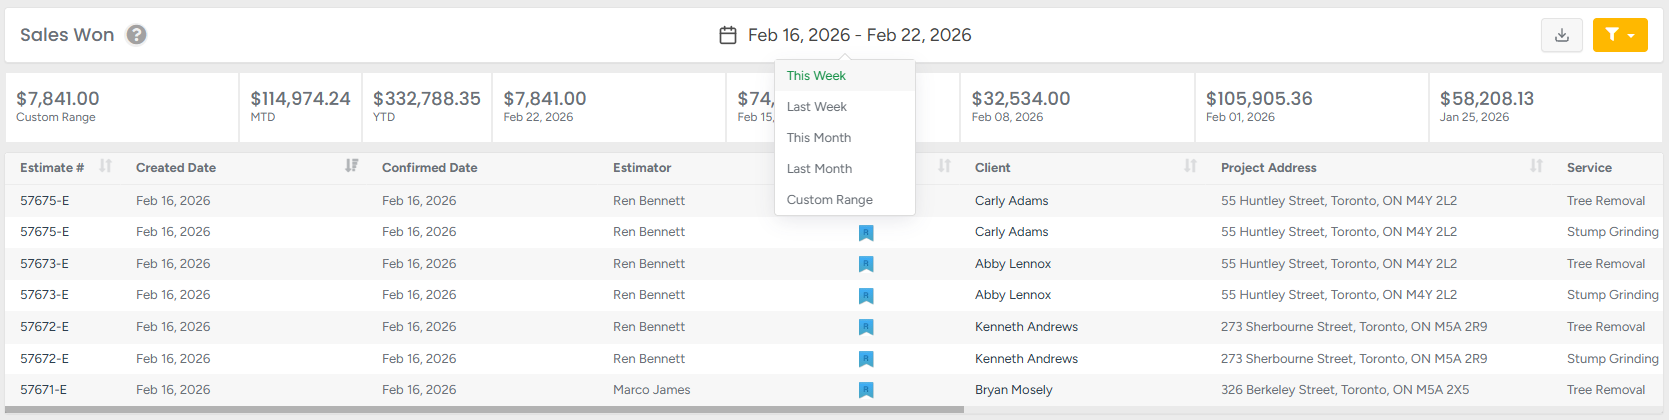
The Sales Won section displays all estimates that have been confirmed (accepted) within the selected date range. This report helps track closed sales, showing breakdowns by service class, discounts, and applied taxes. Use it to monitor booking trends, estimator performance, and overall sales success during specific periods.
To access this section, go to:
Business Intelligence → KPI Reports → Sales Won.
- Click the calendar icon to select the desired date range.
- Press the Download button to export the estimates report in CSV format.
- Apply the Filter to display results by:
Services / Products / Bundles
Classes
Estimators
Multiple options can be selected for each filter.Click the arrow icon to change the sorting order. This option is available only in the columns where the arrow is displayed
Dashboard report

- MTD – displays the total dollar amount of invoices for the current (today’s) month, regardless of applied filters.
- YTD – displays the total dollar amount of invoices for the current (today’s) year, regardless of applied filters.
The next 5 sections of the bar after the MTD and YTD section represent the previous 5 weeks from today’s date, showing the total amounts for each week.
Main Report
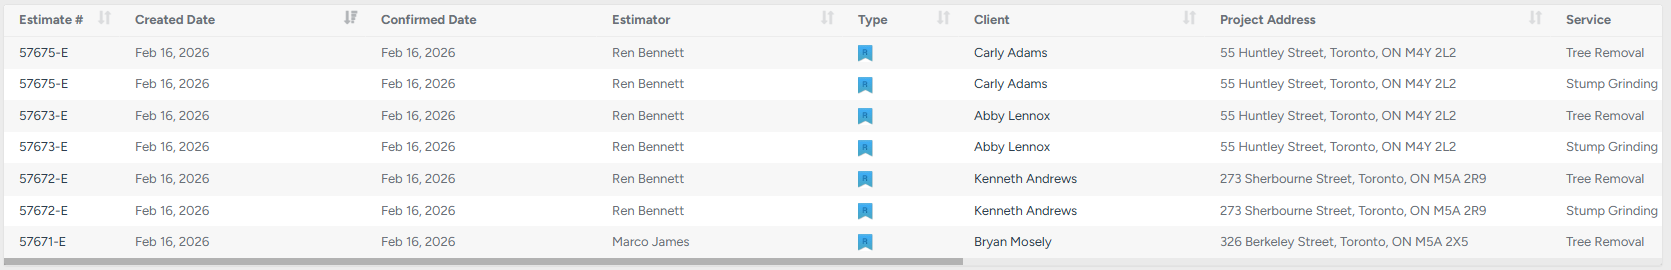
Columns :
Estimate # – unique estimate number; click to open the client’s profile.
Created Date – the date when the estimate was created.
Confirmed Date - the date when the estimate was confirmed.
Estimator – name of the assigned estimator.
Type – client type: residential, commercial, or municipal.
Client – client name; click to open the client’s profile.
Project Address – address of the client’s project.
Service – main service included in the estimate.
Scroll horizontally to view additional columns.
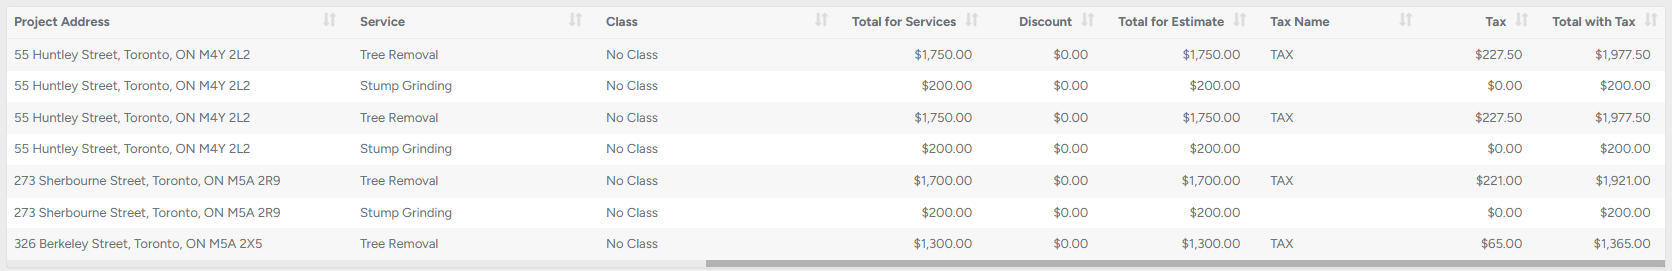
- Class – class assigned to the estimate (if applicable).
Total for Services – subtotal for all services included in the estimate.
Discount – applied discount amount.
Total with estimate – total after discount.
Tax Name – applied tax.
Tax – tax amount.
Total with Tax – final total including tax.
The Sales Won report provides a clear overview of all confirmed estimates within a selected period. It helps managers and estimators evaluate booking trends, analyze revenue, and measure success across different service categories. With export and filtering options, it becomes a powerful tool for performance tracking and sales strategy optimization.
Revenue (Completed)
To access this section, go to:
Business Intelligence → KPI Reports →Revenue (Completed)
- Click the calendar icon to select the desired date range.
- Press the Download button to export the lead report in CSV format.
- Apply the Filter to display results for one or multiple estimators.
- Click the arrow icon to change the sorting order. This option is available only in the columns where the arrow is displayed
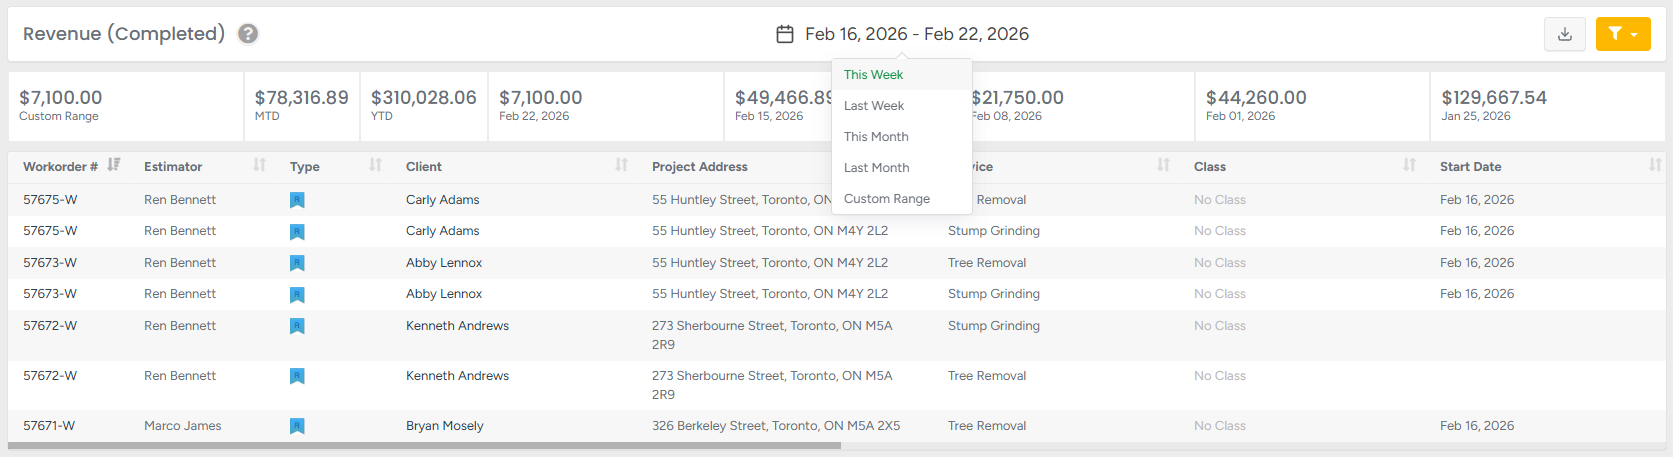
Revenue(completed) shows all services marked as completed within the selected date range, regardless of when they started.
It’s ideal for financial tracking and month-end summaries, giving a clear view of finalized work, including totals, discounts, taxes, and invoice details. Use it to understand what was truly delivered and billable during the period
Dashboard report

- Custom range - shows dollar amounts for a specific date range that the user specifies.
MTD – displays the total dollar amount of invoices for the current (today’s) month, regardless of applied filters.
YTD – displays the total dollar amount of invoices for the current (today’s) year, regardless of applied filters.
The next 5 sections of the bar after the MTD and YTD section represent the previous 5 weeks from today’s date, showing the total amounts for each week.
Main Report
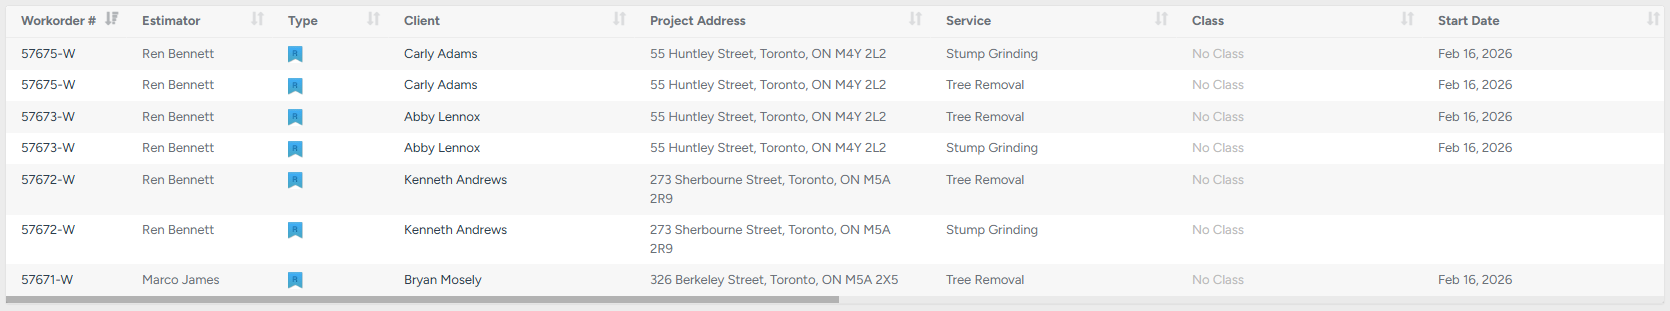
Columns :
Workorder # – unique workorder number; click to open the client’s profile.
Estimator – name of the assigned estimator.
Type – client type: residential, commercial, or municipal.
Client – client name; click to open the client’s profile.
Project Address – address of the client’s project.
Service – main service included in the estimate.
Class – class assigned to the estimate (if applicable).
Start Date – the date when the estimate was started.
Scroll horizontally to view additional columns.
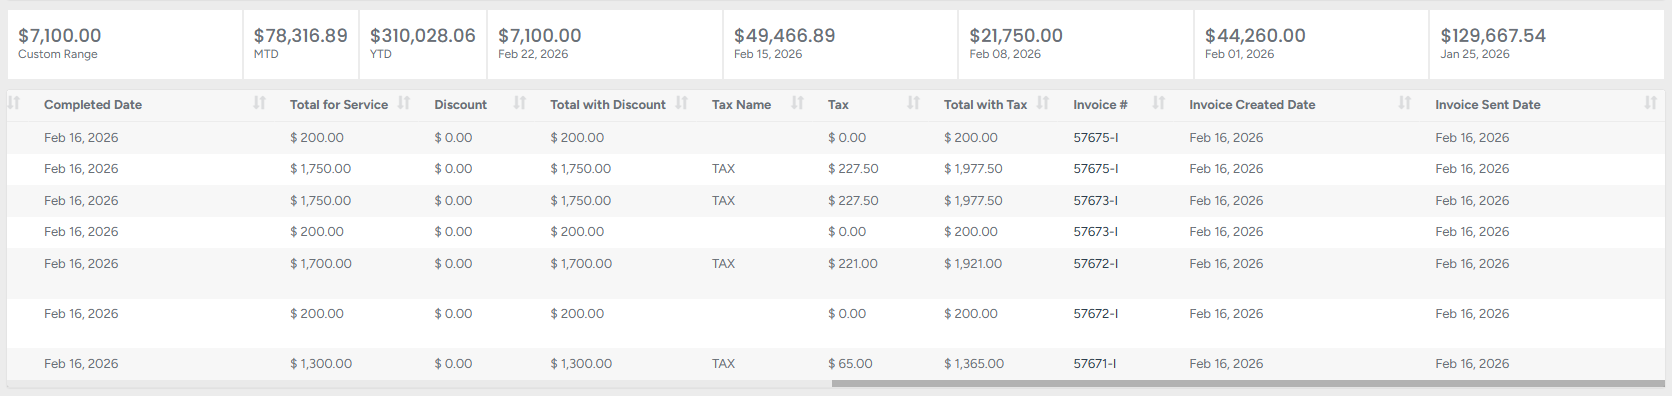
- Completed date - the date when the estimate was completed.
- Total for Services – subtotal for all services included in the estimate.
- Discount – applied discount amount.
- Total with Discount – total after discount.
- Tax Name – applied tax.
- Tax – tax amount.
- Total with Tax – final total including tax.
- Invoice # – unique invoice number; click to open the client’s profile.
- Invoice created date - the date when the invoice was created.
- Invoice sent date - the date when the invoice was sent.
By using the Revenue (Completed) report, managers and accountants gain a clear, accurate picture of completed work and its financial outcome. With filters, export options, and detailed columns, the report ensures transparency and supports effective financial planning and analysis.
Revenue (In Progress)
Revenue(in progress) shows services that have started but are not yet completed. It provides a real-time view of ongoing work, helping you track active jobs, forecast revenue, and manage progress. The report updates dynamically as service statuses change, ensuring you always see the most up-to-date picture of in-progress income.
To access this section, go to:
Business Intelligence → KPI Reports →Revenue (In Progress)
- Click the calendar icon to select the desired date range.
- Press the Download button to export the estimates report in CSV format.
- Apply the Filter to display results by:
Services / Products / Bundles
Classes
Estimators
Multiple options can be selected for each filter.Click the arrow icon to change the sorting order. This option is available only in the columns where the arrow is displayed
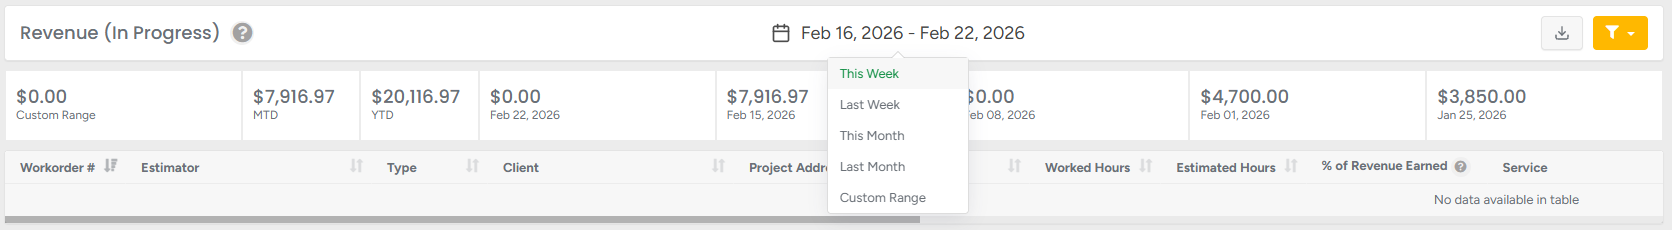
Dashboard report
- Custom range - shows dollar amounts for a specific date range that the user specifies.
MTD – displays the total dollar amount of invoices for the current (today’s) month, regardless of applied filters.
YTD – displays the total dollar amount of invoices for the current (today’s) year, regardless of applied filters.
The next 5 sections of the bar after the MTD and YTD section represent the previous 5 weeks from today’s date, showing the total amounts for each week.
Columns :
Workorder # – unique workorder number; click to open the client’s profile.
Estimator – name of the assigned estimator.
Type – client type: residential, commercial, or municipal.
Client – client name; click to open the client’s profile.
Project Address – address of the client’s project.
Worked Hours – hours already logged on the project.
Estimated Hours – projected total hours for completion.
% of Revenue Earned – percentage of revenue based on work completed vs. estimated total.
Service – main service included in the estimate.
Scroll horizontally to view additional columns.
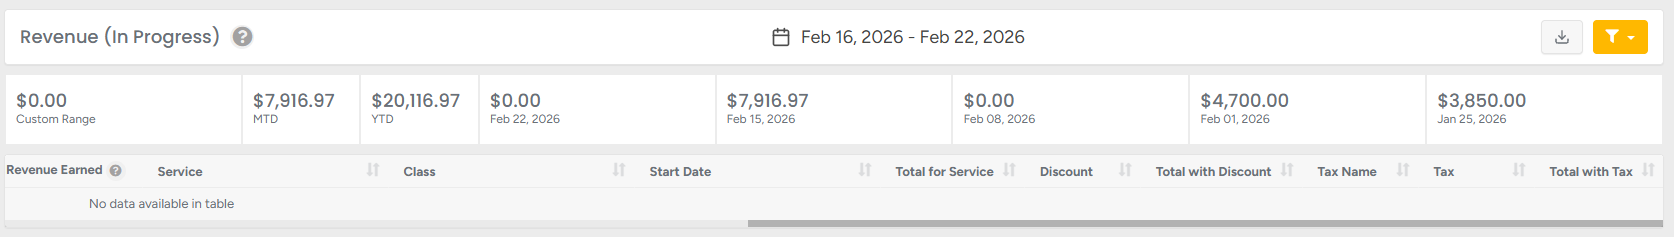
- Class – class assigned to the estimate (if applicable)
- Start date – the date when the project was started.
Total for Services – subtotal for all services included in the estimate.
Discount – applied discount amount.
Total with Discount – total after discount.
Tax Name – applied tax.
Tax – tax amount.
Total with Tax – final total including tax.
The Revenue (In Progress) report gives you a clear, real-time view of active jobs. By combining financial details with work progress indicators, it helps you stay ahead on forecasting, resource planning, and revenue tracking — ensuring no ongoing value goes unnoticed.
Revenue (Backlog)
Revenue (Backlog) shows upcoming workorders with jobs that haven’t started yet and services that are not marked as completed or declined. It helps forecast future revenue by listing jobs on the crew schedule that are assigned but not yet in progress. Use it to see what’s booked for this week, next week, and beyond- grouped by scheduled dates
To access this section, go to:
Business Intelligence → KPI Reports →Revenue (Backlog)
- Click the calendar icon to select the desired date range.
- Press the Download button to export the estimates report in CSV format.
- Apply the Filter to display results by:
Services / Products / Bundles
Classes
Estimators
Multiple options can be selected for each filter.Click the arrow icon to change the sorting order. This option is available only in the columns where the arrow is displayed
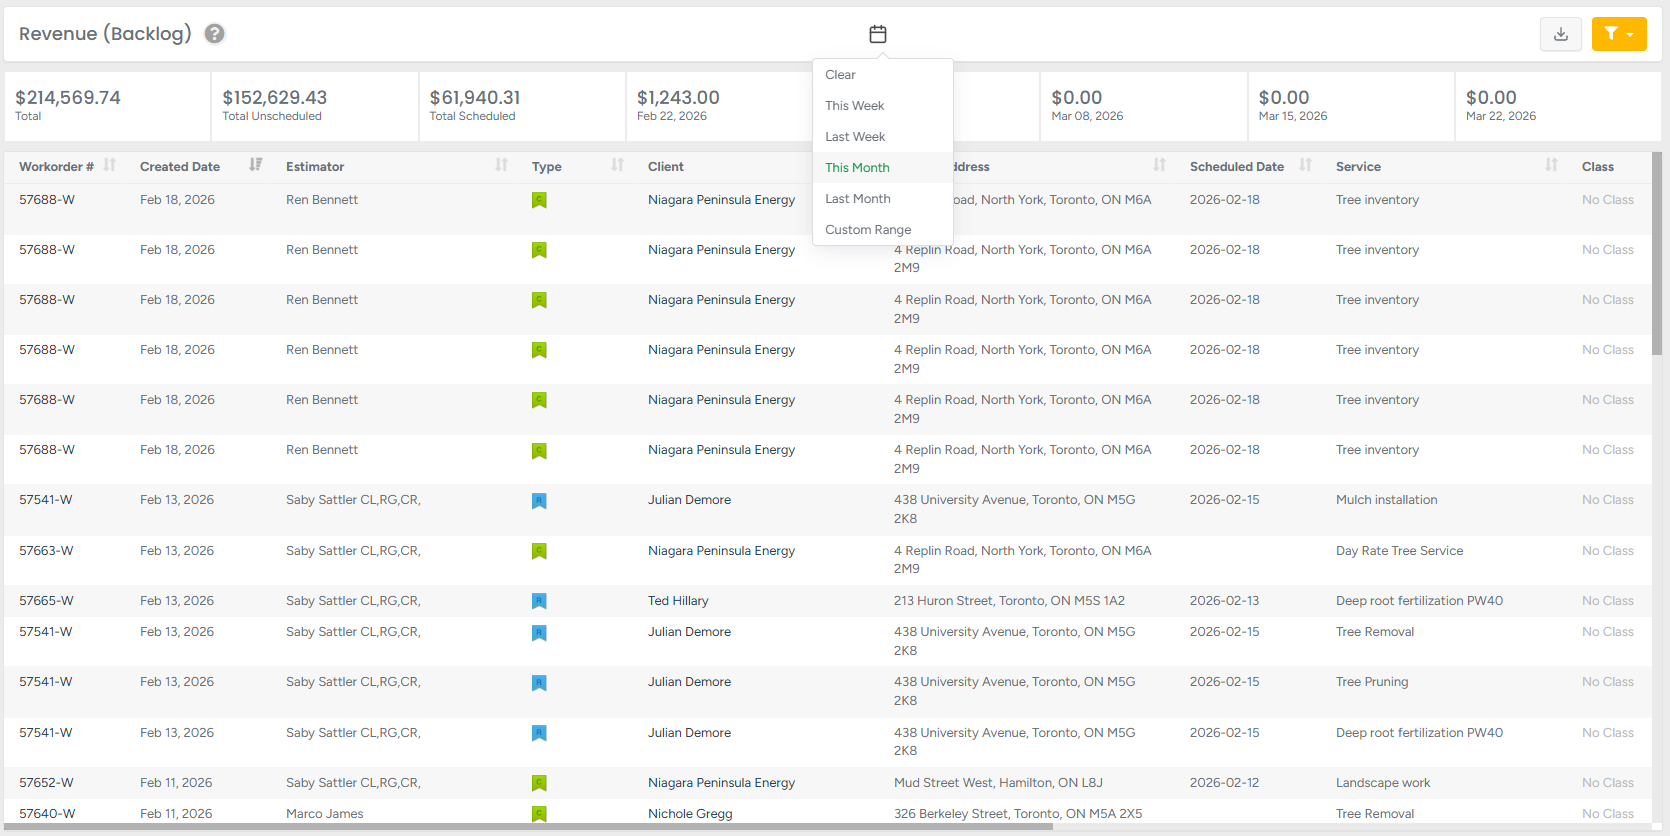
Dashboard report

- Custom range - shows dollar amounts for a specific date range that the user specifies.
MTD – displays the total dollar amount of invoices for the current (today’s) month, regardless of applied filters.
YTD – displays the total dollar amount of invoices for the current (today’s) year, regardless of applied filters.
The next 5 sections of the bar after the MTD and YTD section represent the previous 5 weeks from today’s date, showing the total amounts for each week.
Main Report
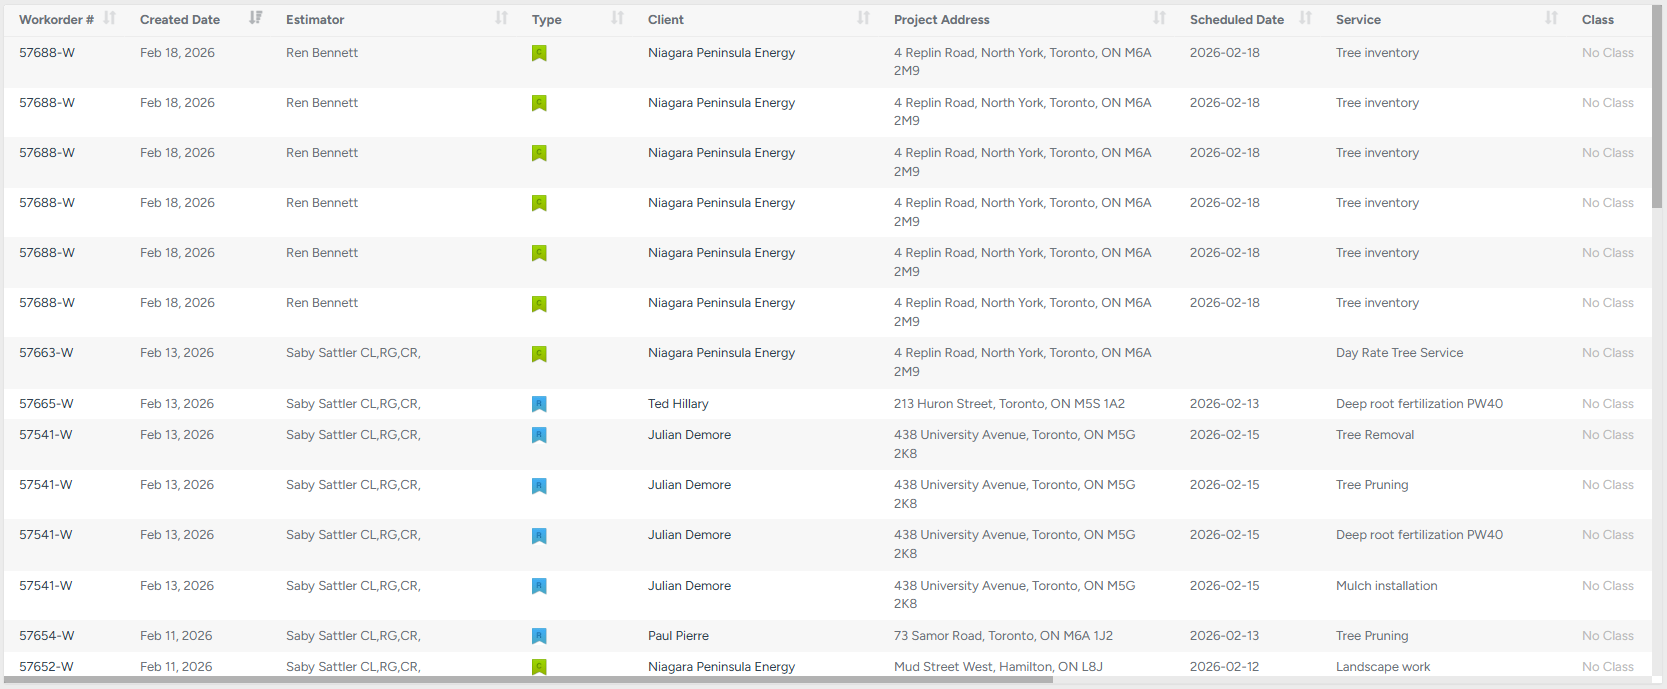
Columns :
Workorder # – unique workorder number; click to open the client’s profile.
Estimator – name of the assigned estimator.
Type – client type: residential, commercial, or municipal.
Client – client name; click to open the client’s profile.
Project Address – address of the client’s project.
Scheduled Date – the date when the workorder was scheduled.
Service – main service included in the estimate.
- Class – class assigned to the estimate (if applicable)
Scroll horizontally to view additional columns.
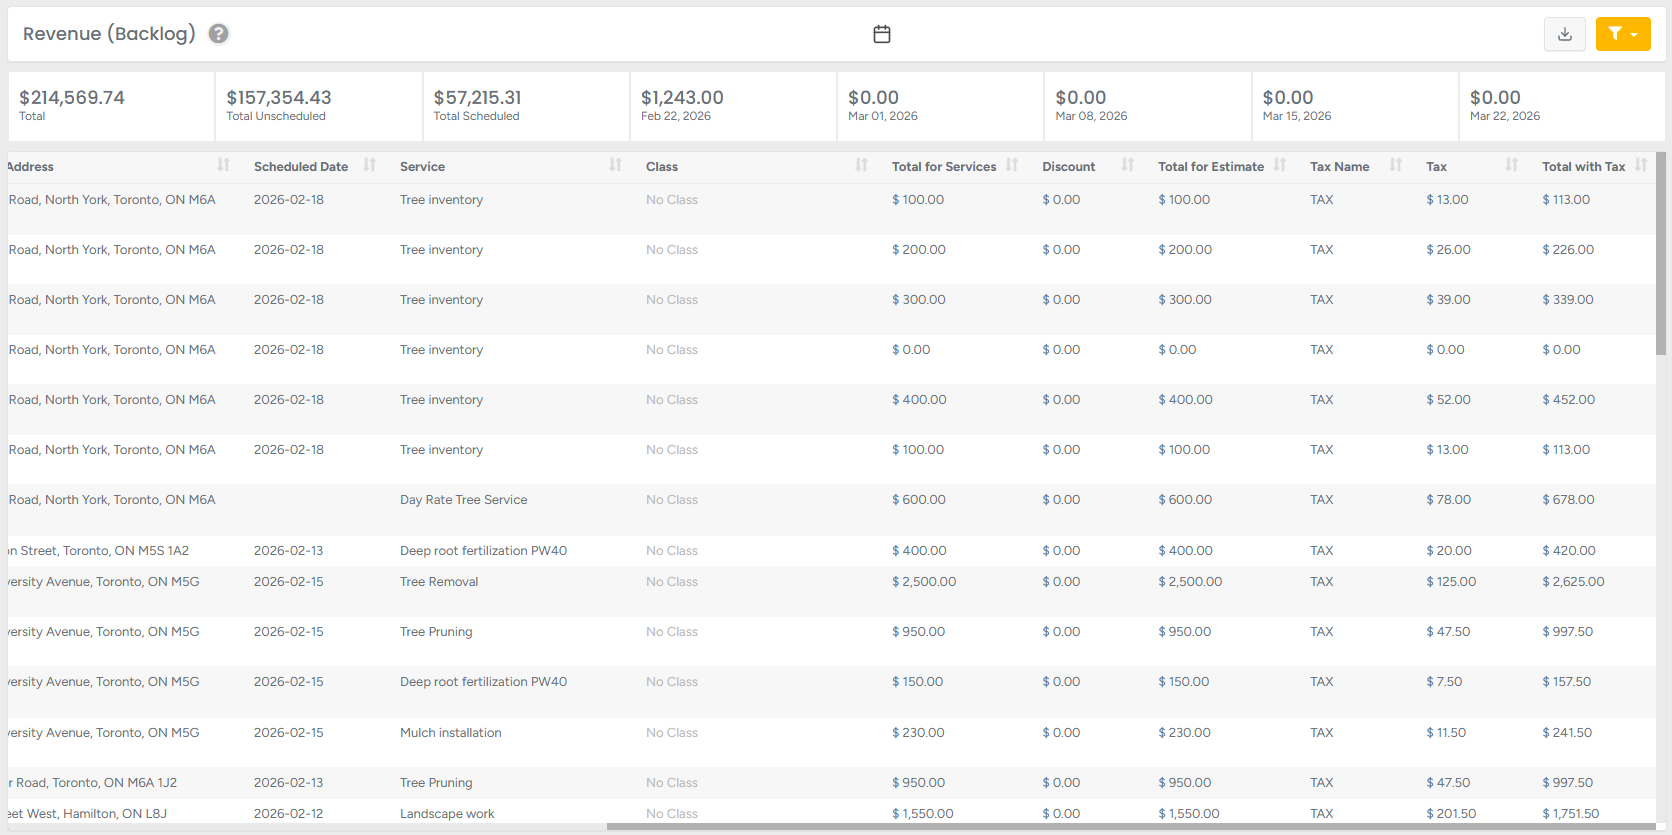
Total for Services – subtotal for all services included in the estimate.
Discount – applied discount amount.
Total with Discount – total after discount.
Tax Name – applied tax.
Tax – tax amount.
Total with Tax – final total including tax.
Revenue (Backlog) – Shows the total value of approved or scheduled services that have not started yet. It provides a forward-looking view of upcoming work in the pipeline, allowing managers to review scheduled dates, service details, and financial breakdowns to forecast workload and expected income accurately. With filtering and export options, it supports efficient planning and revenue tracking.
A/R Aging
A/R aging shows a snapshot* of unpaid invoices as of a specific date, based on their creation date.
It helps track how long each invoice has remained unpaid by grouping them into aging buckets(0-30, 31-60, etc).
Use this report to monitor overdue balances and understand your receivable history for any given day.
To access this section, go to:
Business Intelligence → KPI Reports →A/R Aging.
- Click the calendar icon to select the desired date.
- Press the Download button to export the estimates report in CSV format.
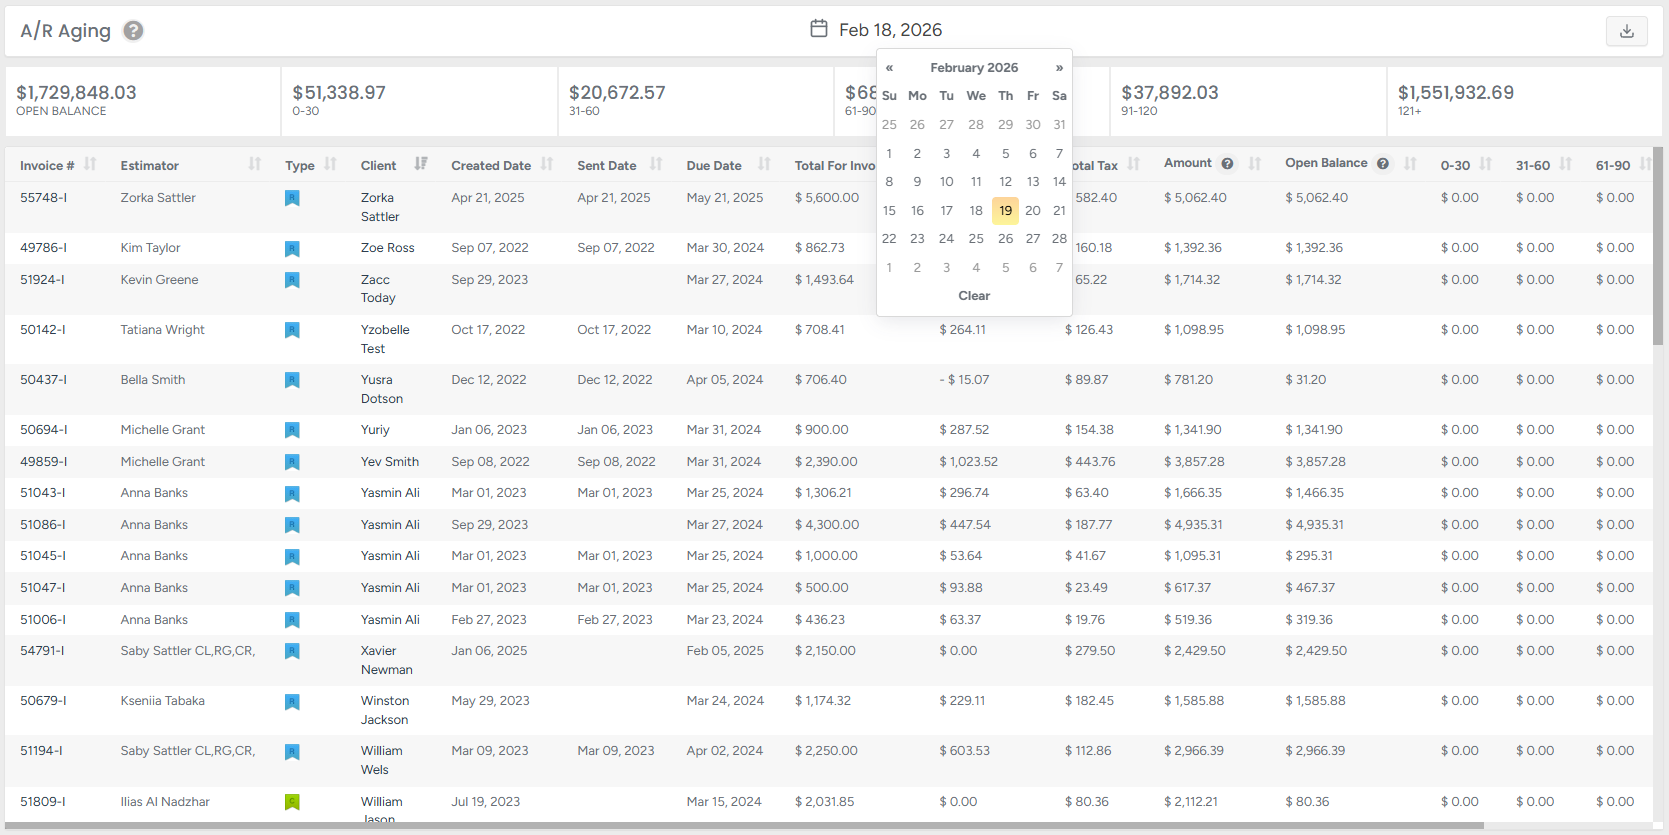
Dashboard report

Open Balance - unpaid amount remaining on the invoice.
- 0–30 – balance overdue between 0 and 30 days.
- 31–60 – balance overdue between 31 and 60 days.
- 61–90 – balance overdue between 61 and 90 days.
- 91–120 – balance overdue between 91 and 120 days.
- 121+ – balance overdue after 121 days.
Main Report
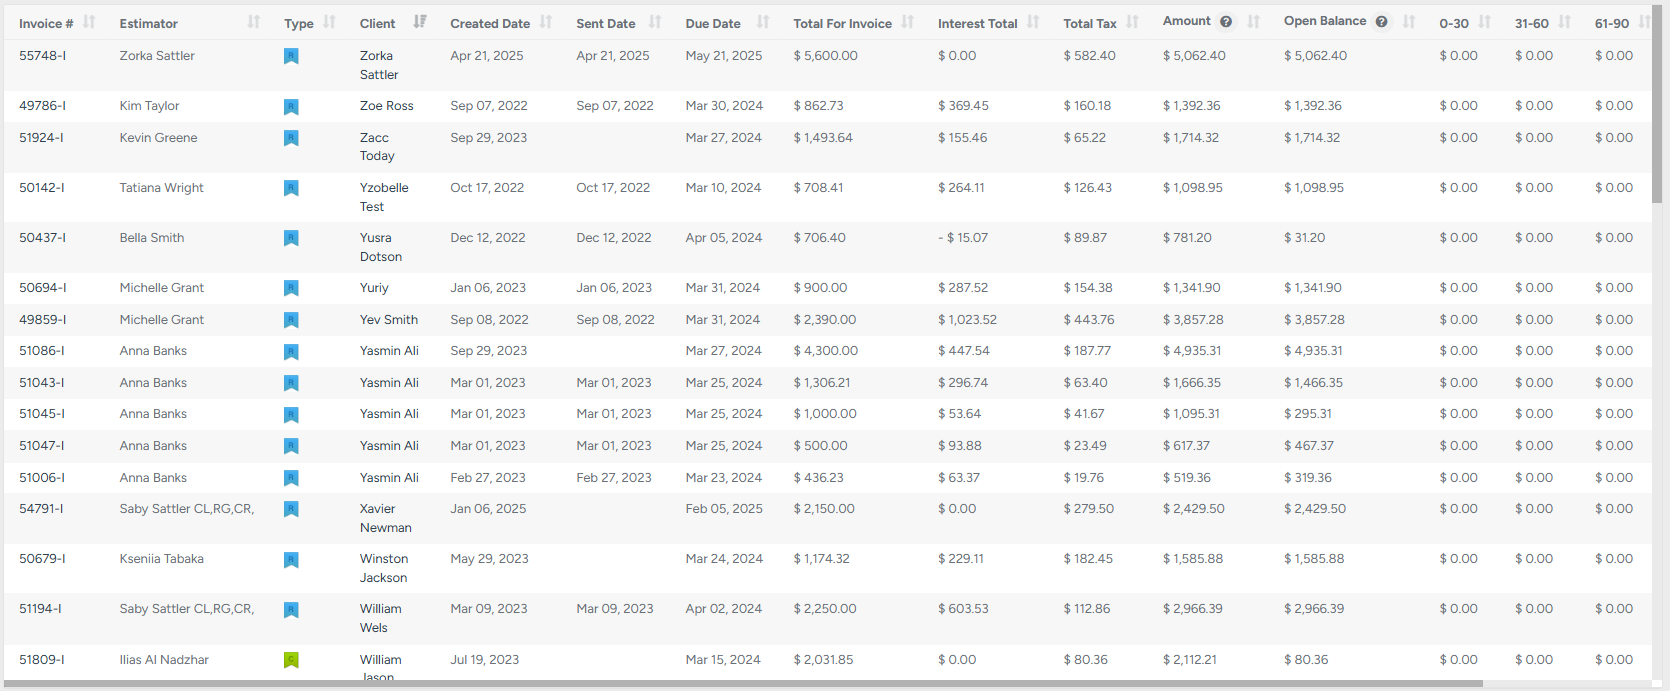
Columns :
Invoice # – unique invoice number; click to open the client’s profile.
Estimator – name of the assigned estimator.
Type – client type: residential, commercial, or municipal.
Client – client name; click to open the client’s profile.
Invoice Dates
Created Date – the date when the invoice was generated.
Sent Date – the date when the invoice was sent to the client.
Due Date – the date by which payment must be received.
Financial Details
Total for Invoice – subtotal before taxes and interest.
Interest Total – total interest applied (if applicable).
Total Tax – tax amount applied to the invoice.
Amount – final total including tax and interest.
Outstanding Balance (Aging Buckets)
Open Balance – unpaid amount remaining on the invoice.
0–30 – balance overdue between 0 and 30 days.
31–60 – balance overdue between 31 and 60 days.
61–90 – balance overdue between 61 and 90 days.
91–120 – balance overdue between 91 and 120 days.
121+ – balance overdue after 121 days.
The "snapshot" nature of this report preserves data as it was on the respective timestamp, including credit notes.
When you run a report for a past date (like February 28), the system only looks for Credit Notes that were created on or before that date.
The A/R Aging report provides a clear breakdown of unpaid invoices, grouped by how long they’ve been outstanding. By reviewing overdue balances across defined time buckets, managers can quickly identify collection priorities, monitor financial health, and take timely action to improve cash flow.
Estimators Sales provides a performance overview of each estimator, displaying key activity metrics such as appointments, assigned leads, created estimates, and confirmed estimates across MTD, YTD, the last five full weeks, or a custom date range.
To access this section, go to:
Business Intelligence → KPI Reports → Estimator Sales
- Click the calendar icon to select the desired date.
- Press the Download button to export the estimates report in CSV format.
- Apply the Filterto display results by:
Classes
Estimators
Multiple options can be selected for each filter.
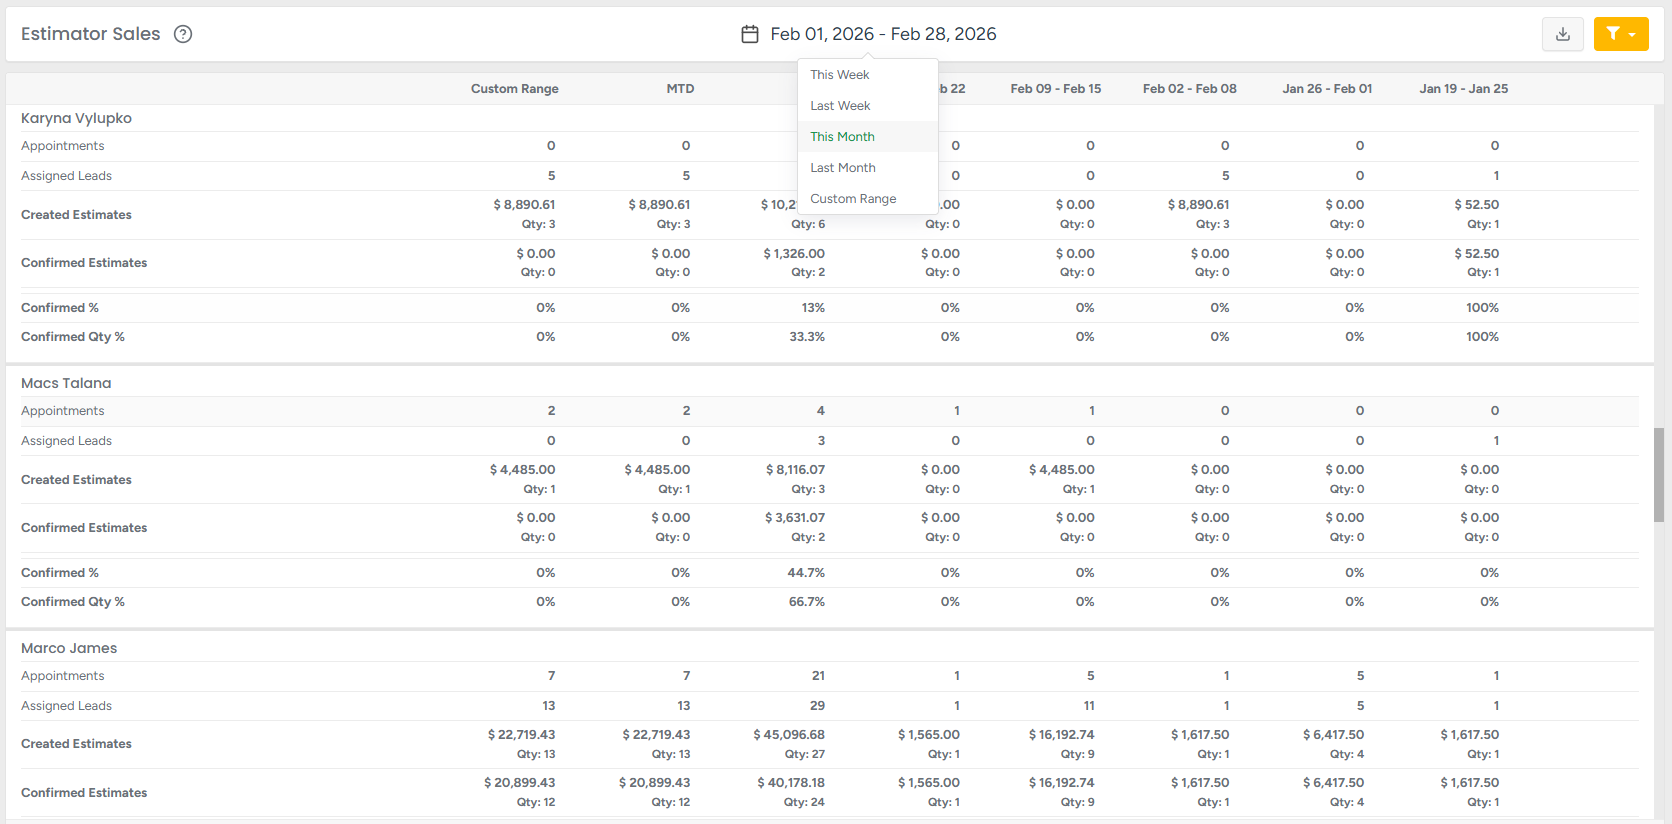
The report groups all metrics by Estimator name.
Each estimator displays the following performance data:
Appointments – Total number of tasks scheduled within the selected task date range, including tasks assigned directly to a client without a lead and tasks linked to a client with a lead. (Based on task date, not task creation date.)
Assigned Leads – Total leads assigned within the selected period, based on the lead creation date.
Created Estimates – Total service value including tax for all created estimates.
Confirmed Estimates – Total service value including tax for all confirmed estimates.
The KPI Reports module delivers clear, structured insights across every stage of your operational and financial workflow — from new leads and estimator activity to estimates, completed revenue, backlog, and overdue invoices. It combines high-level performance snapshots with detailed drill-down reports, including Estimator Sales, to help managers, sales teams, and accounting staff track productivity, forecast income, and monitor cash flow. With flexible filters, export options, and easy-to-read visual indicators, KPI Reports support faster, smarter, and more data-driven decisions across your business.