Analyzing your Estimates
In the Own Estimates submodule, an estimator can find all information related to the estimates assigned specifically to them (quantity of estimates, their statuses, and the revenue).
- To access this submodule, navigate to Estimates → Own. Check the image below, the top part.
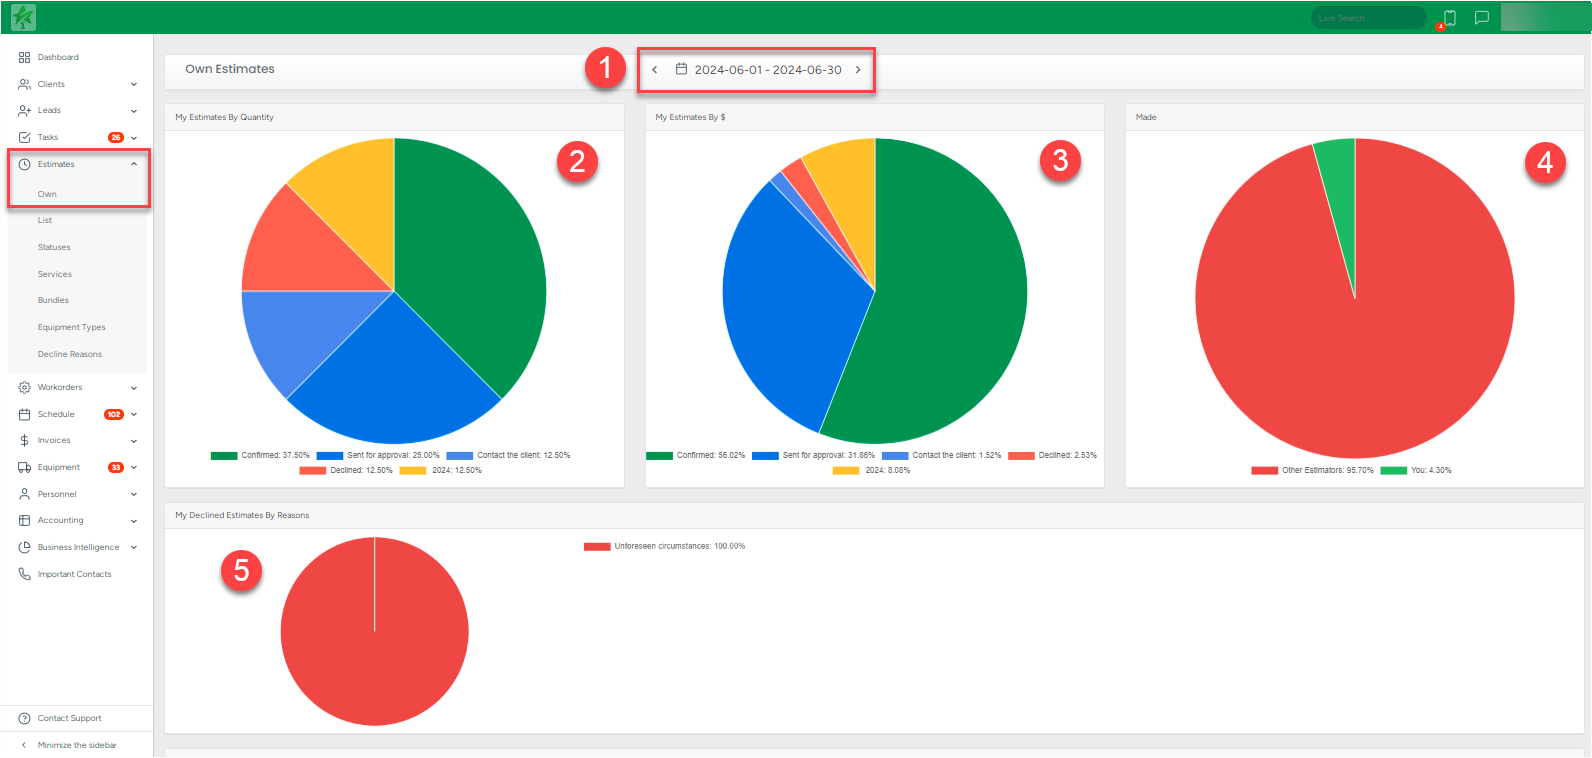
Now let's discuss the functionality in detail:
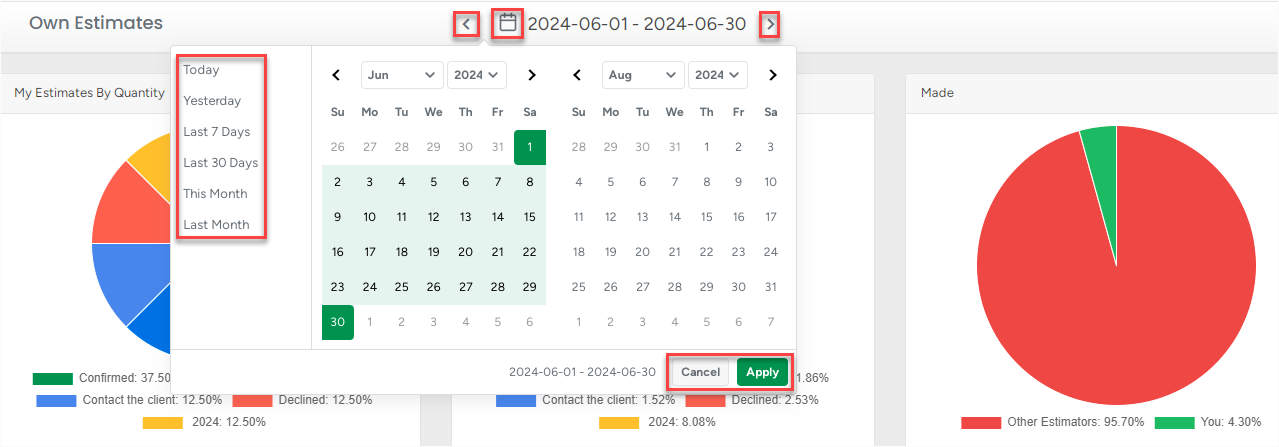
- The Calendar. By clicking the calendar icon, you can select a specific time to pull data about the estimates: Today, Yesterday, Last 7 days, Last 30 days, This Month, and Last Month. By default, it shows the plan for the current week. To view the plan for the previous or next week, click the arrow (< or >) buttons accordingly.
- The My Estimates by Quantity graph shows, in percentage, how many estimates with a specific status were made compared to all estimates created. Clicking on the statuses in the legend under the pie chart hides them from the chart.
- The My Estimates by $ graph shows in percentage how much money was made based on the estimates with a specific status. Clicking on the statuses in the legend under the pie chart hides them from the chart.
- The Made graph shows, in percentage, how many estimates the user (estimator) made compared to other estimators. Clicking on the statuses in the legend under the pie chart hides them from the chart.
- The My Declined Estimates By Reasons graph shows in percentage only the estimates with declined status and reason in comparison to all estimates created.
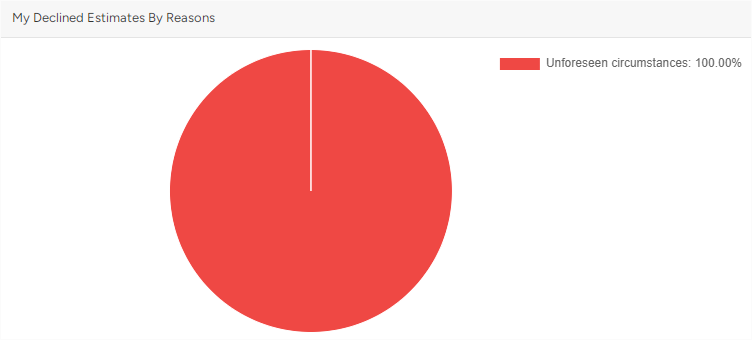 The My Declined Estimates by Reasons section, just under the graph,s shows the estimator's declined projects and reasons for cancellation.
Scrolling down even further reveals the list of estimates that were assigned specifically to you as an estimator. This section has a set of active buttons.
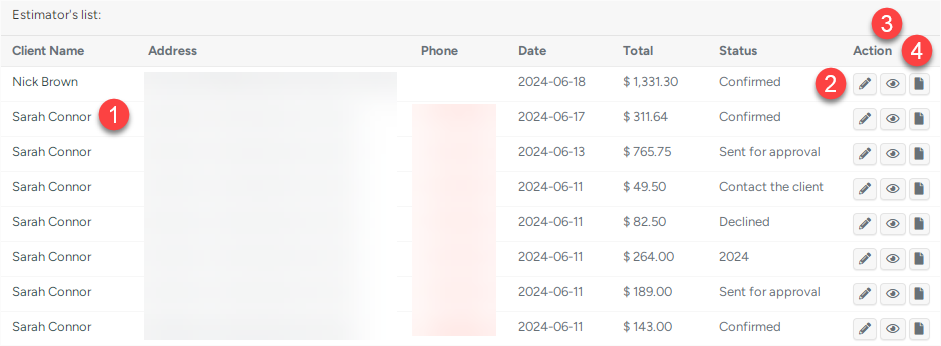
- Clicking the estimator’s name redirects you to the client profile.
- Clicking the pencil icon opens the estimate's profile in edit mode.
- Clicking the eye icon redirects you to the regular estimate's profile.
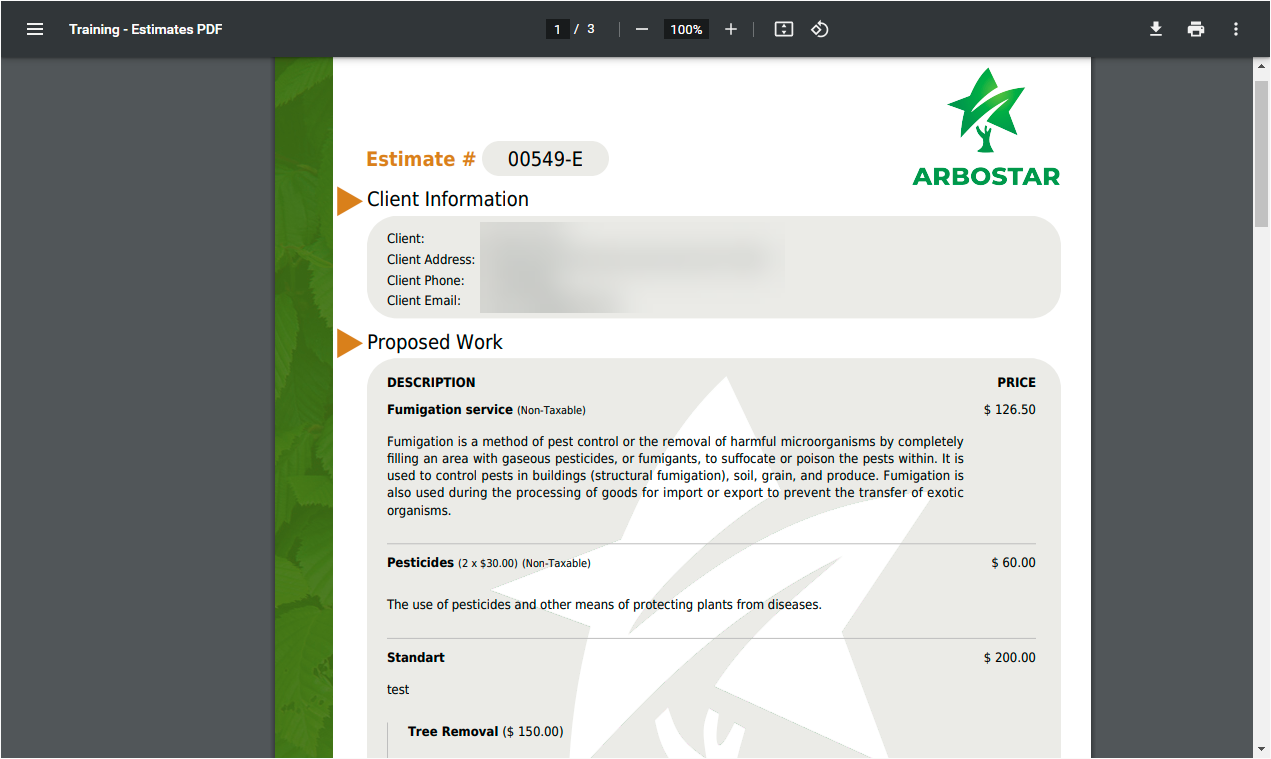
- Clicking the file icon opens the estimated PDF file in a new tab of the browser.
Example: How an estimate file looks, once the file icon is clicked.