
In the Estimates module, users can view a graph in the Decline Reasons section showing the percentage breakdown of all recorded decline reasons, along with the specific reasons tied to individual Estimates. The data can be filtered by date range, decline reason, client, price, services, and estimator.
- To access the submodule, navigate to Estimates → Decline Reasons.
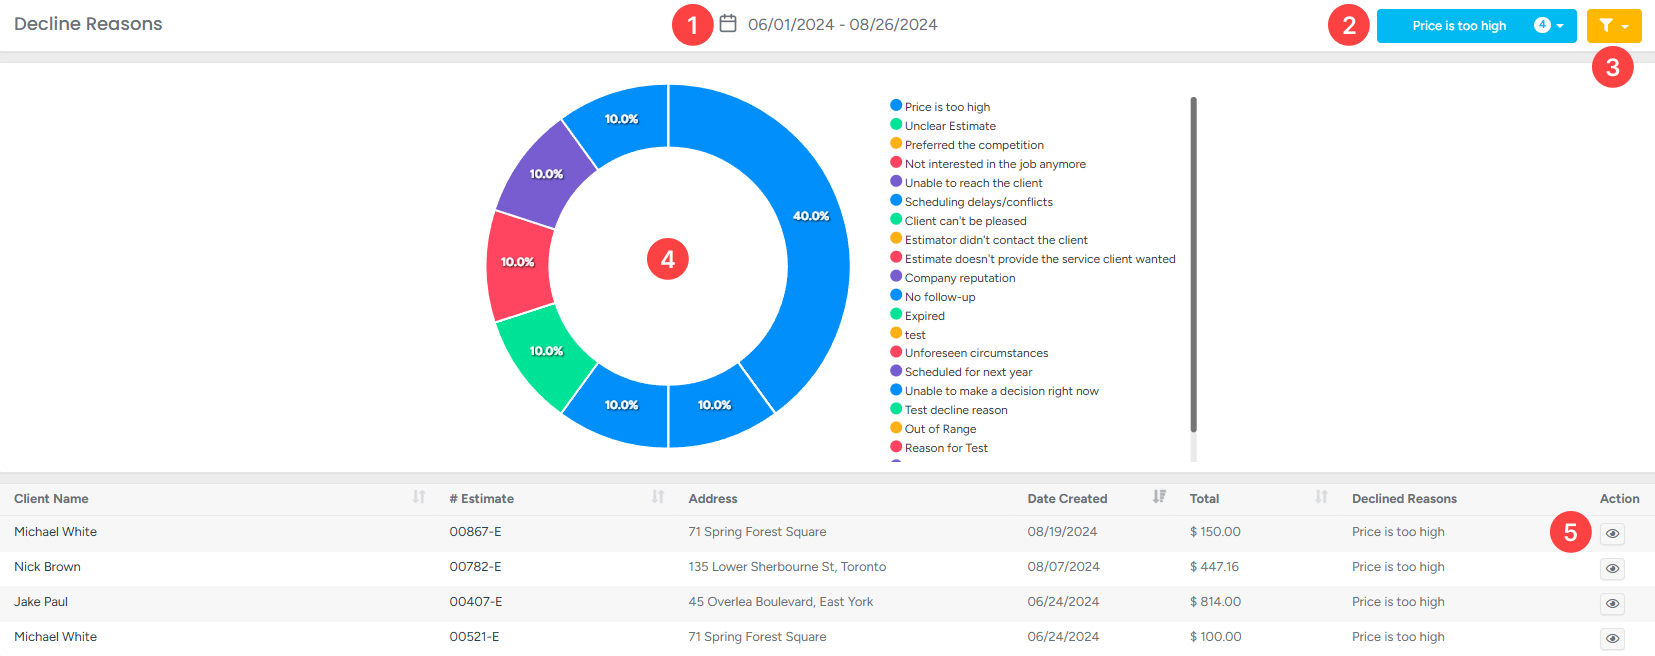
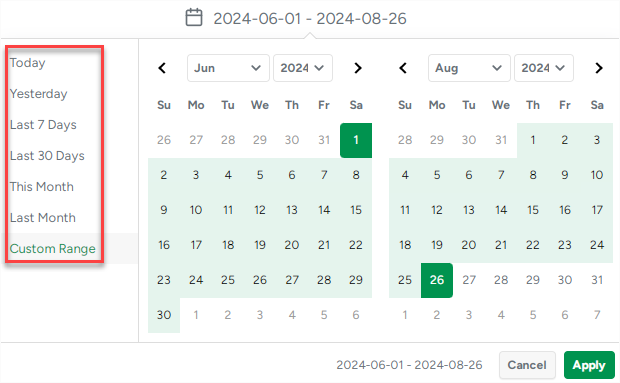
1. Clicking the actual date period allows you to change it. The following options can be selected:
- Today
- Yesterday
- Last 7 days
- Last 30 days
- This Month
- Last Month
- Custom range
Once a specific date range is selected, the chart will update to display data for that period.
Below is the modal window that appears when the Custom Range option is selected. Choose the start and end dates for the desired period. Click Apply to confirm your selection, or Cancel to close the window without making changes.
2. Clicking the Blue Filter button lets you select all, multiple, or specific decline reasons you want to display on the chart.
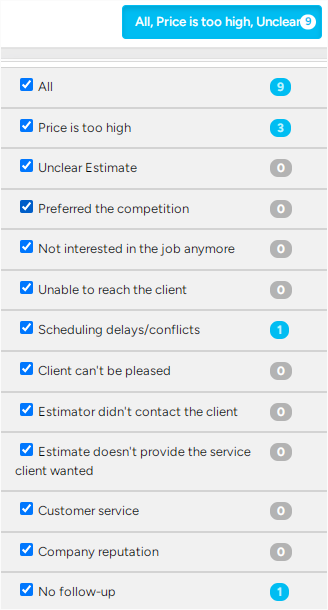
The numbers displayed next to each decline reason indicate how many estimates in the system were marked with that reason. For example, in the screenshot above, there are 3 estimates associated with the Price is too high decline reason.
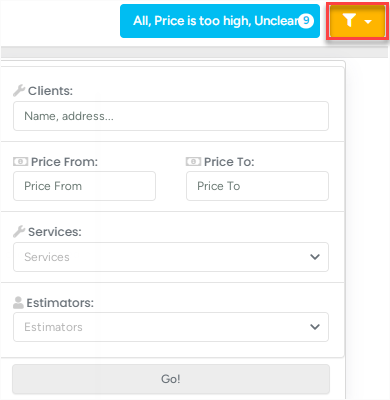
3. Clicking the Yellow Filter button lets users filter chart data by client, price range, services, and estimators. To apply the selected filters, click Go!.
4. The chart displays data as percentages based on the selected filters and date range (see points 1–3). Each decline reason is represented by a specific color, which you can reference in the legend located to the right of the chart.
5. Clicking the Eye button takes you directly to the Estimate profile.