Overview of the Email Statistics module
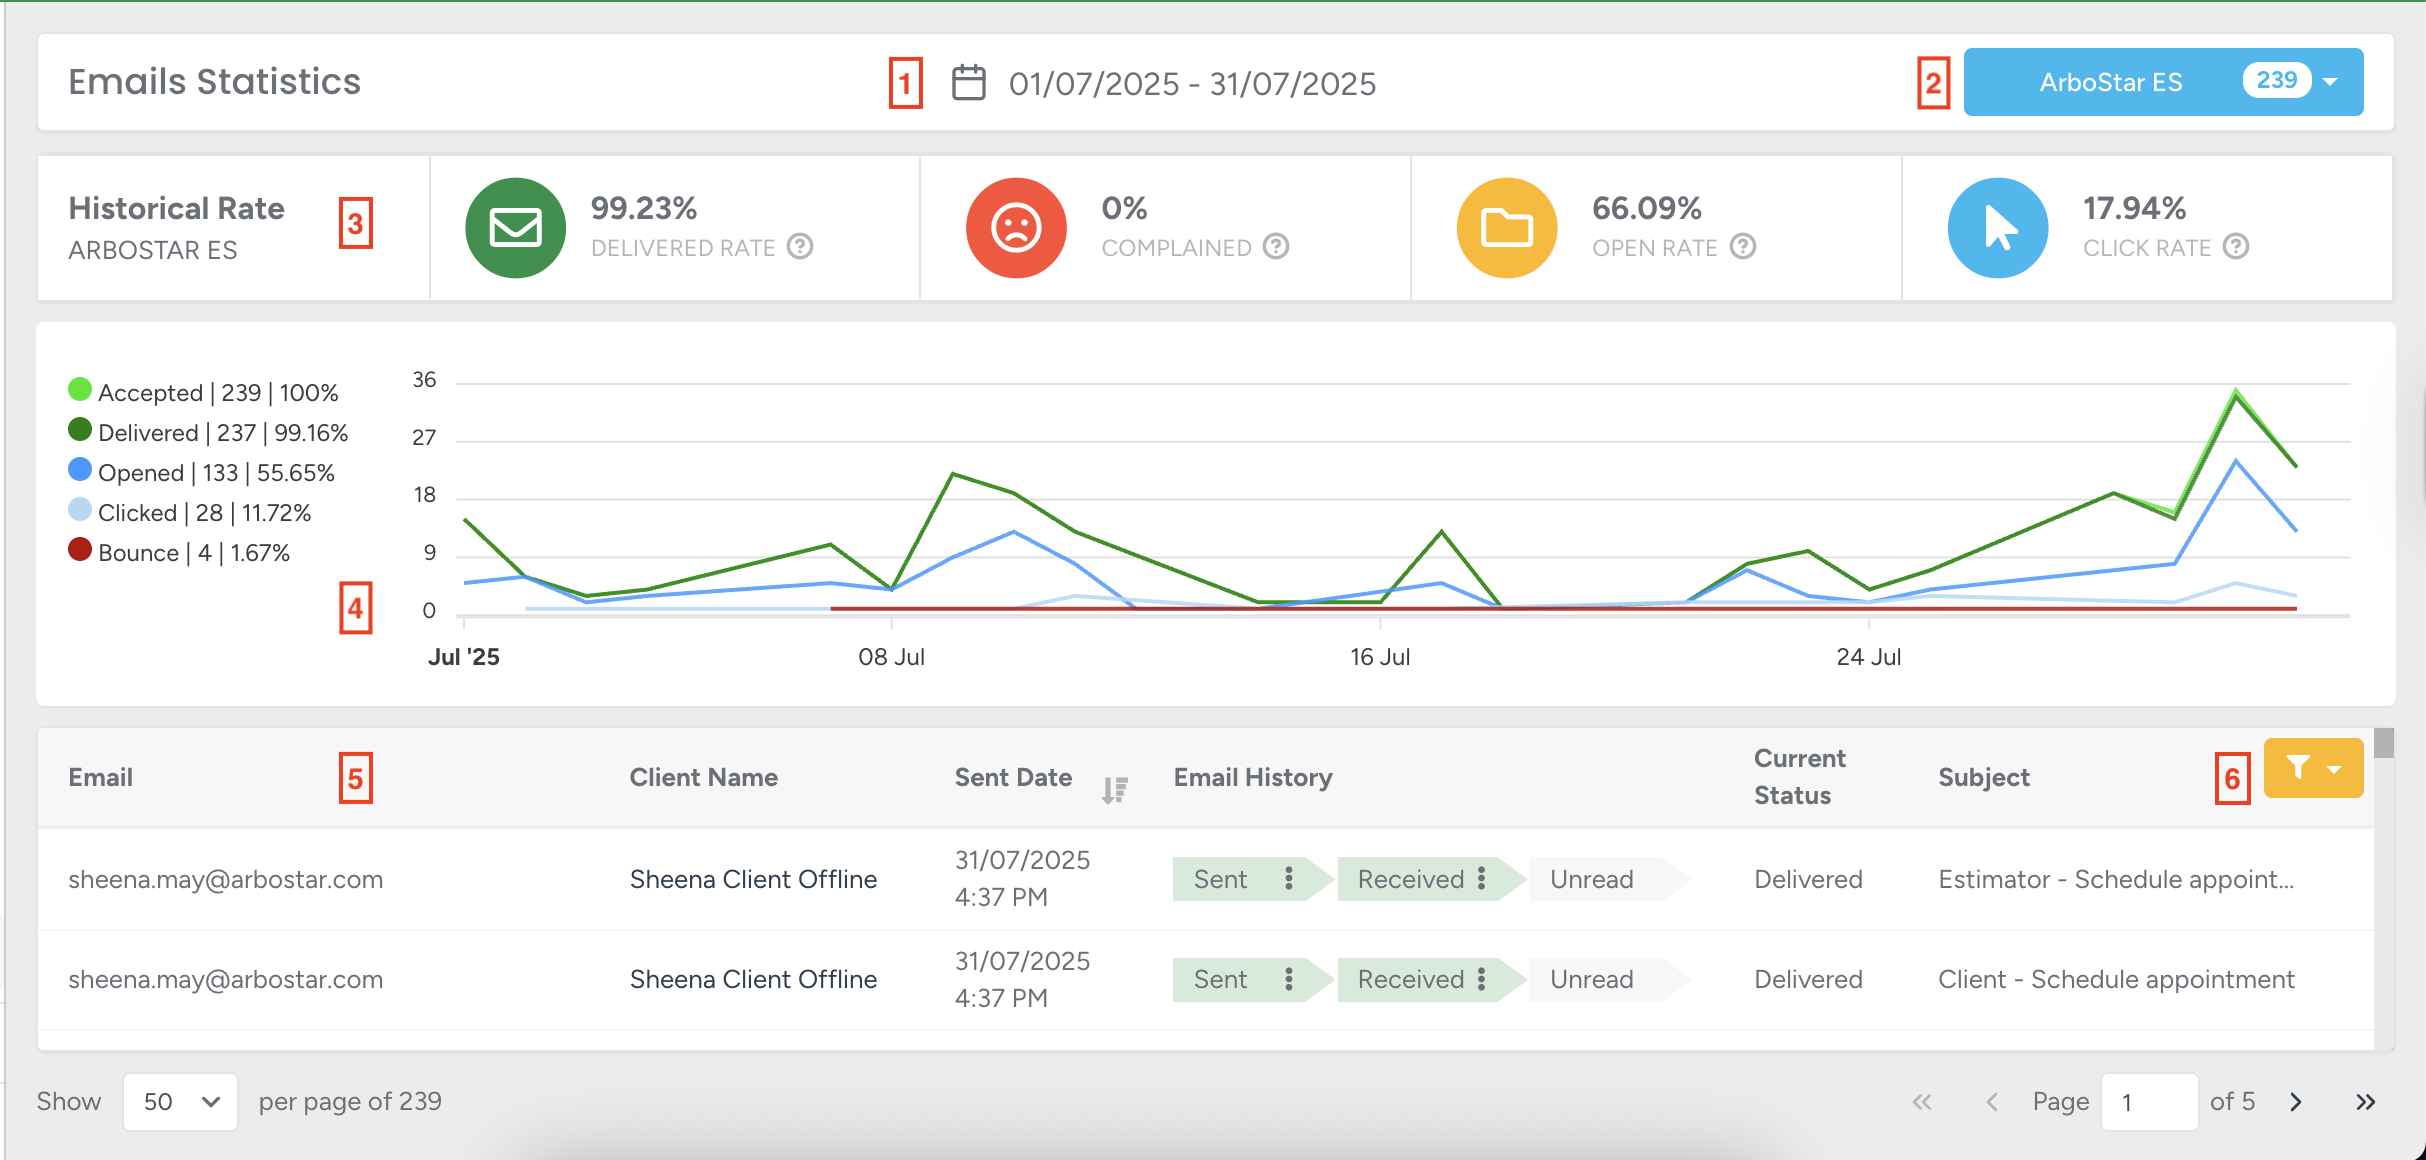
The Email Statistics module provides a comprehensive overview of the lifecycle of your sent emails, allowing you to track their performance and pinpoint areas for improvement.
This module is useful when you want to understand what stage your sent emails are in.
You can access it via Business Intelligence → Clients → Email Statistics.

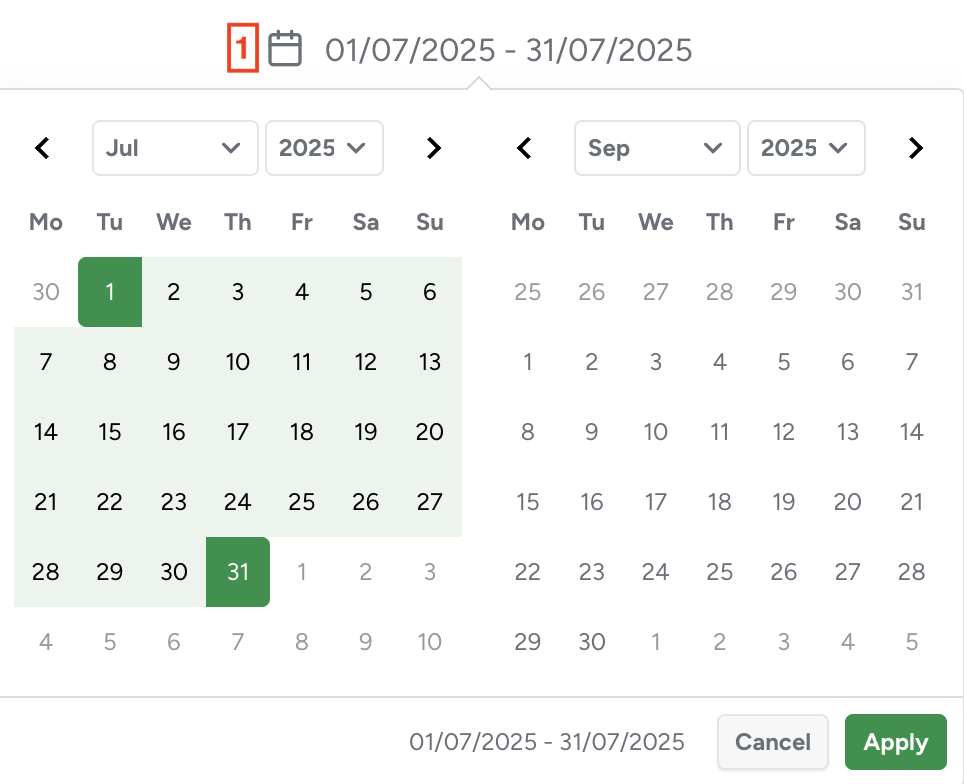
1 — Select a Period
Choose any date range to view the statistics for that timeframe. To filter the statistics based on start and end dates, click on the "date” fields, choose the start and end dates, and click Apply.
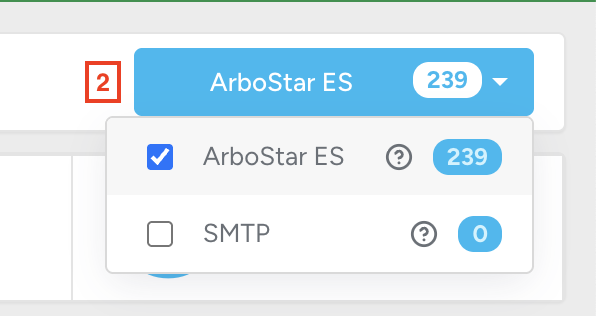
 2 — Select a Source
Pick between ArboStarES or SMTP to see data from the specific sending channel.
3 — Historical Rate Panel
View cumulative performance metrics over all time, including:
- Delivered Rate
- Complained
- Open Rate
- Click Rate
4 — Interactive Chart
See visual data for accepted, delivered, opened, clicked, and bounced emails.
Click any metric in the legend to hide or show it.
For example: All metrics selected → full performance view

Clicked and Bounce hidden → cleaner delivery/open trends

5 — Detailed Email List
A complete list showing:
- Email address
- Client name
- Sent date
- Email history
- Current status
- Subject
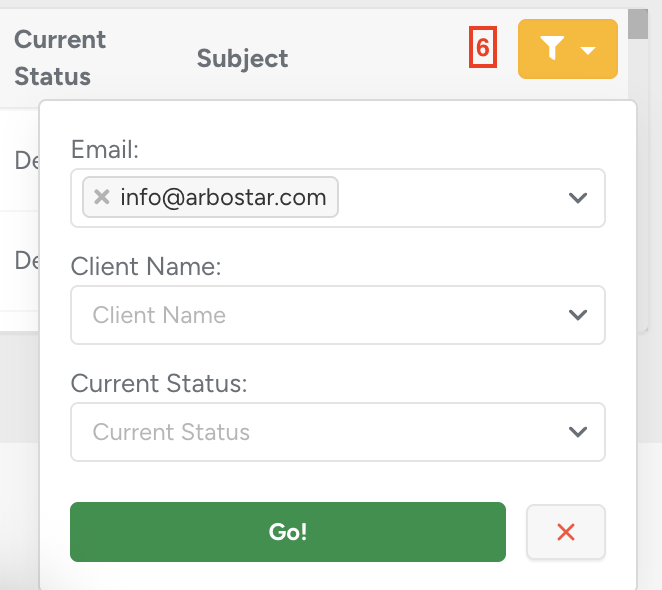
Use filters to narrow results by email address, client name, or current status. Press Go to apply filters, or ❌ to clear them.
This structured view makes it easier to analyze email performance, troubleshoot delivery issues, and keep communication workflows running smoothly.
