
Lead Statistics Overview
The Lead Statistics module provides a detailed overview of lead generation, conversion performance, and sales results. It helps evaluate the effectiveness of Lead Source Details and measure the overall health of your sales pipeline.
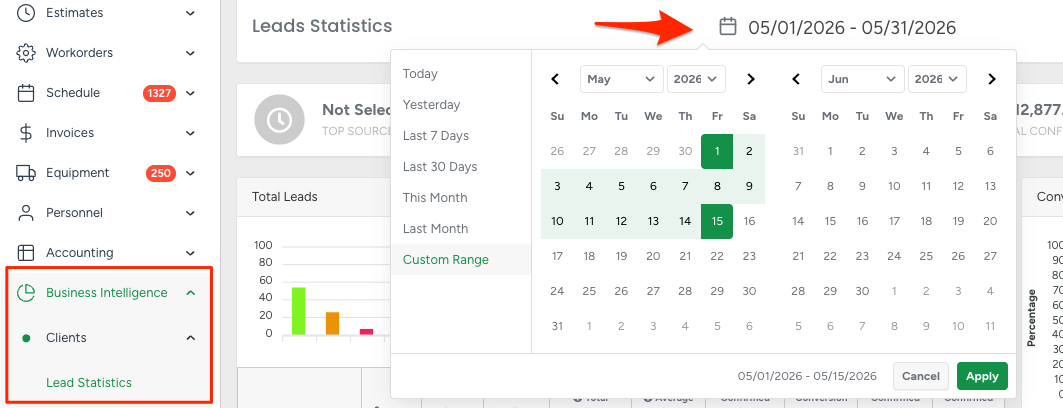
Access path: Business Intelligence → Clients → Lead Statistics.
Date Selection
You can set a specific date range by clicking on the calendar icon.
Filters
Results can be refined using the following filters:
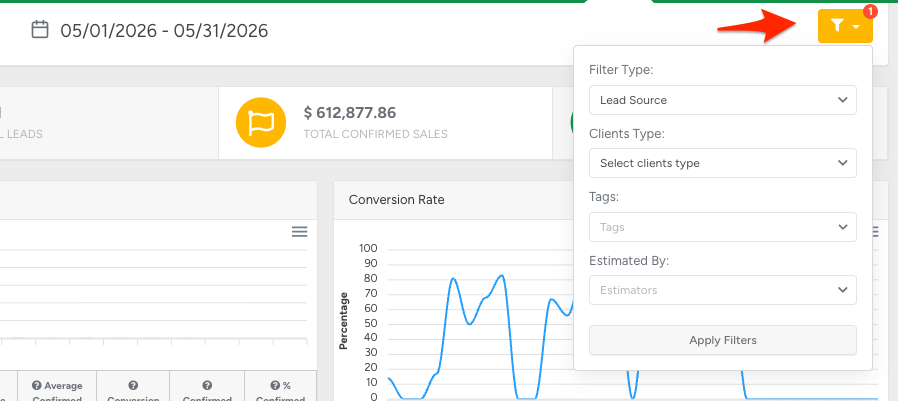
Filter type — default: Lead Source Details; also available: UTM Source, Google Click ID, etc.
Client type — Residential, Commercial, Municipal
Tags - The report displays leads that contain at least one of the active tags. Users can select one or multiple tags when generating the report.
Estimated by - Estimator's name
Dashboard Summary
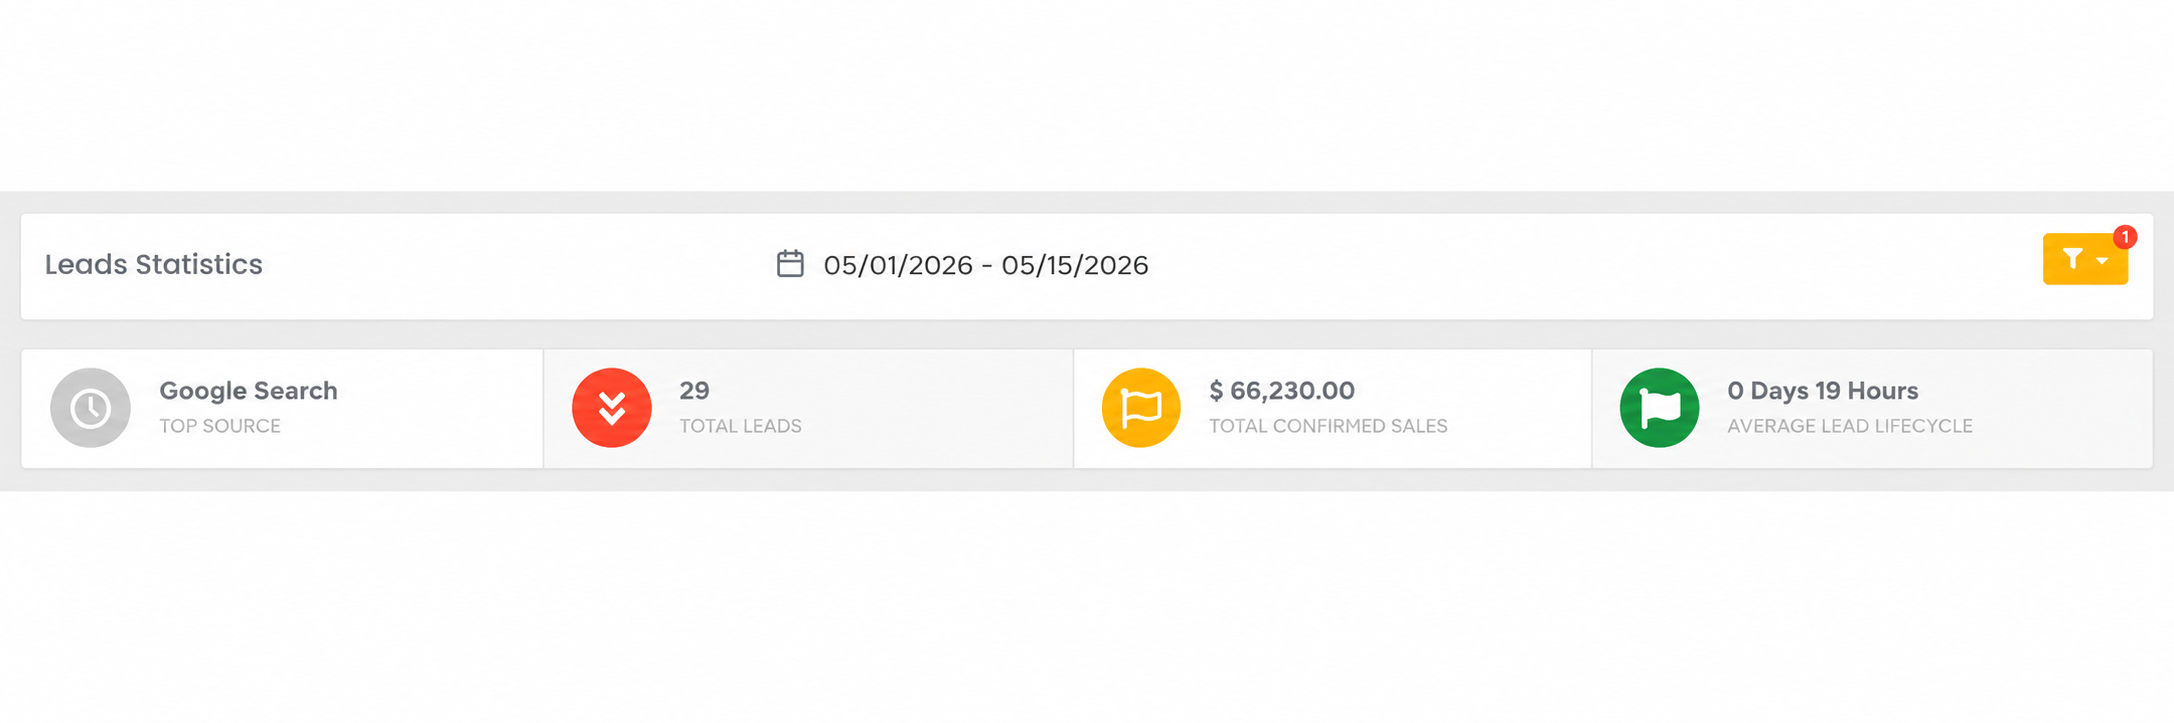
The dashboard highlights four key metrics:
Top Source — identifies the main lead source for the selected period
Total Leads — number of leads acquired
Total Confirmed Sales — revenue generated from converted leads
Average Lead Lifecycle — time from lead creation to confirmed estimate(only business days)
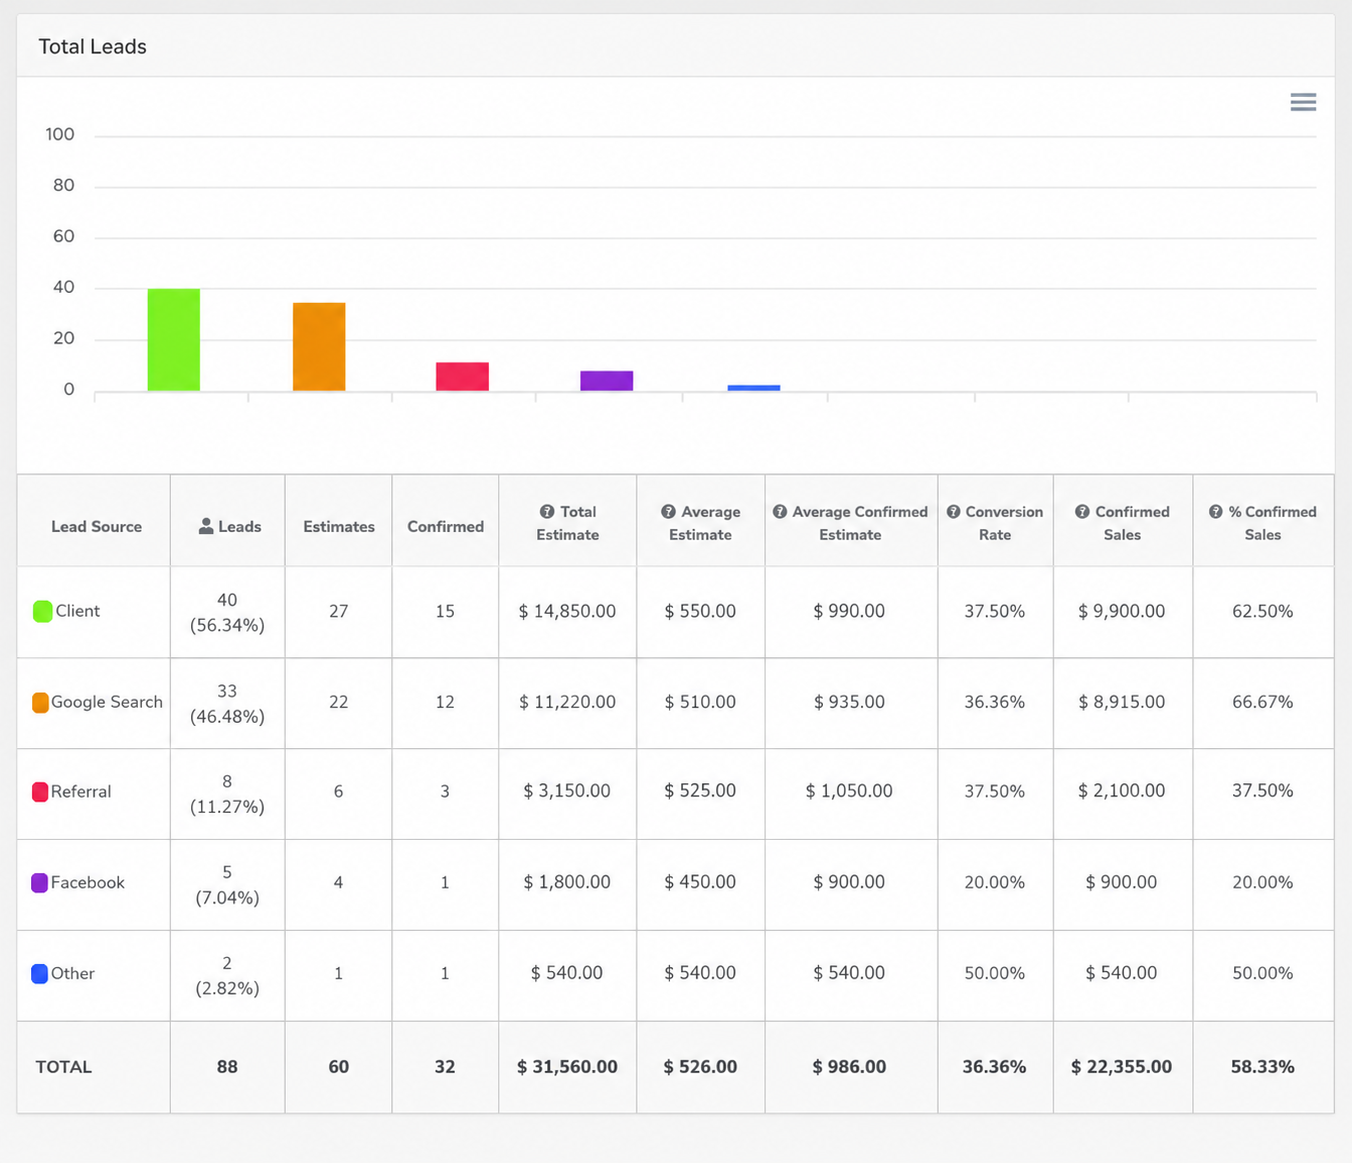
Total Leads
On the left side of the screen, the Total Leads field displays lead generation and sales performance broken down by Lead Source.
This section helps to:
Identify the most effective Lead Source channels
Evaluate their contribution to total leads
Make informed decisions about resource allocation and marketing efforts
To see more detailed information about where your leads are coming from in the Total Leads table:
Client and Employee are always clickable to show detailed referral data.
Other Lead Sources are clickable only if Allow adding details for this lead source is enabled for that source.
Lead Sources without additional details enabled will not open a drill down view.
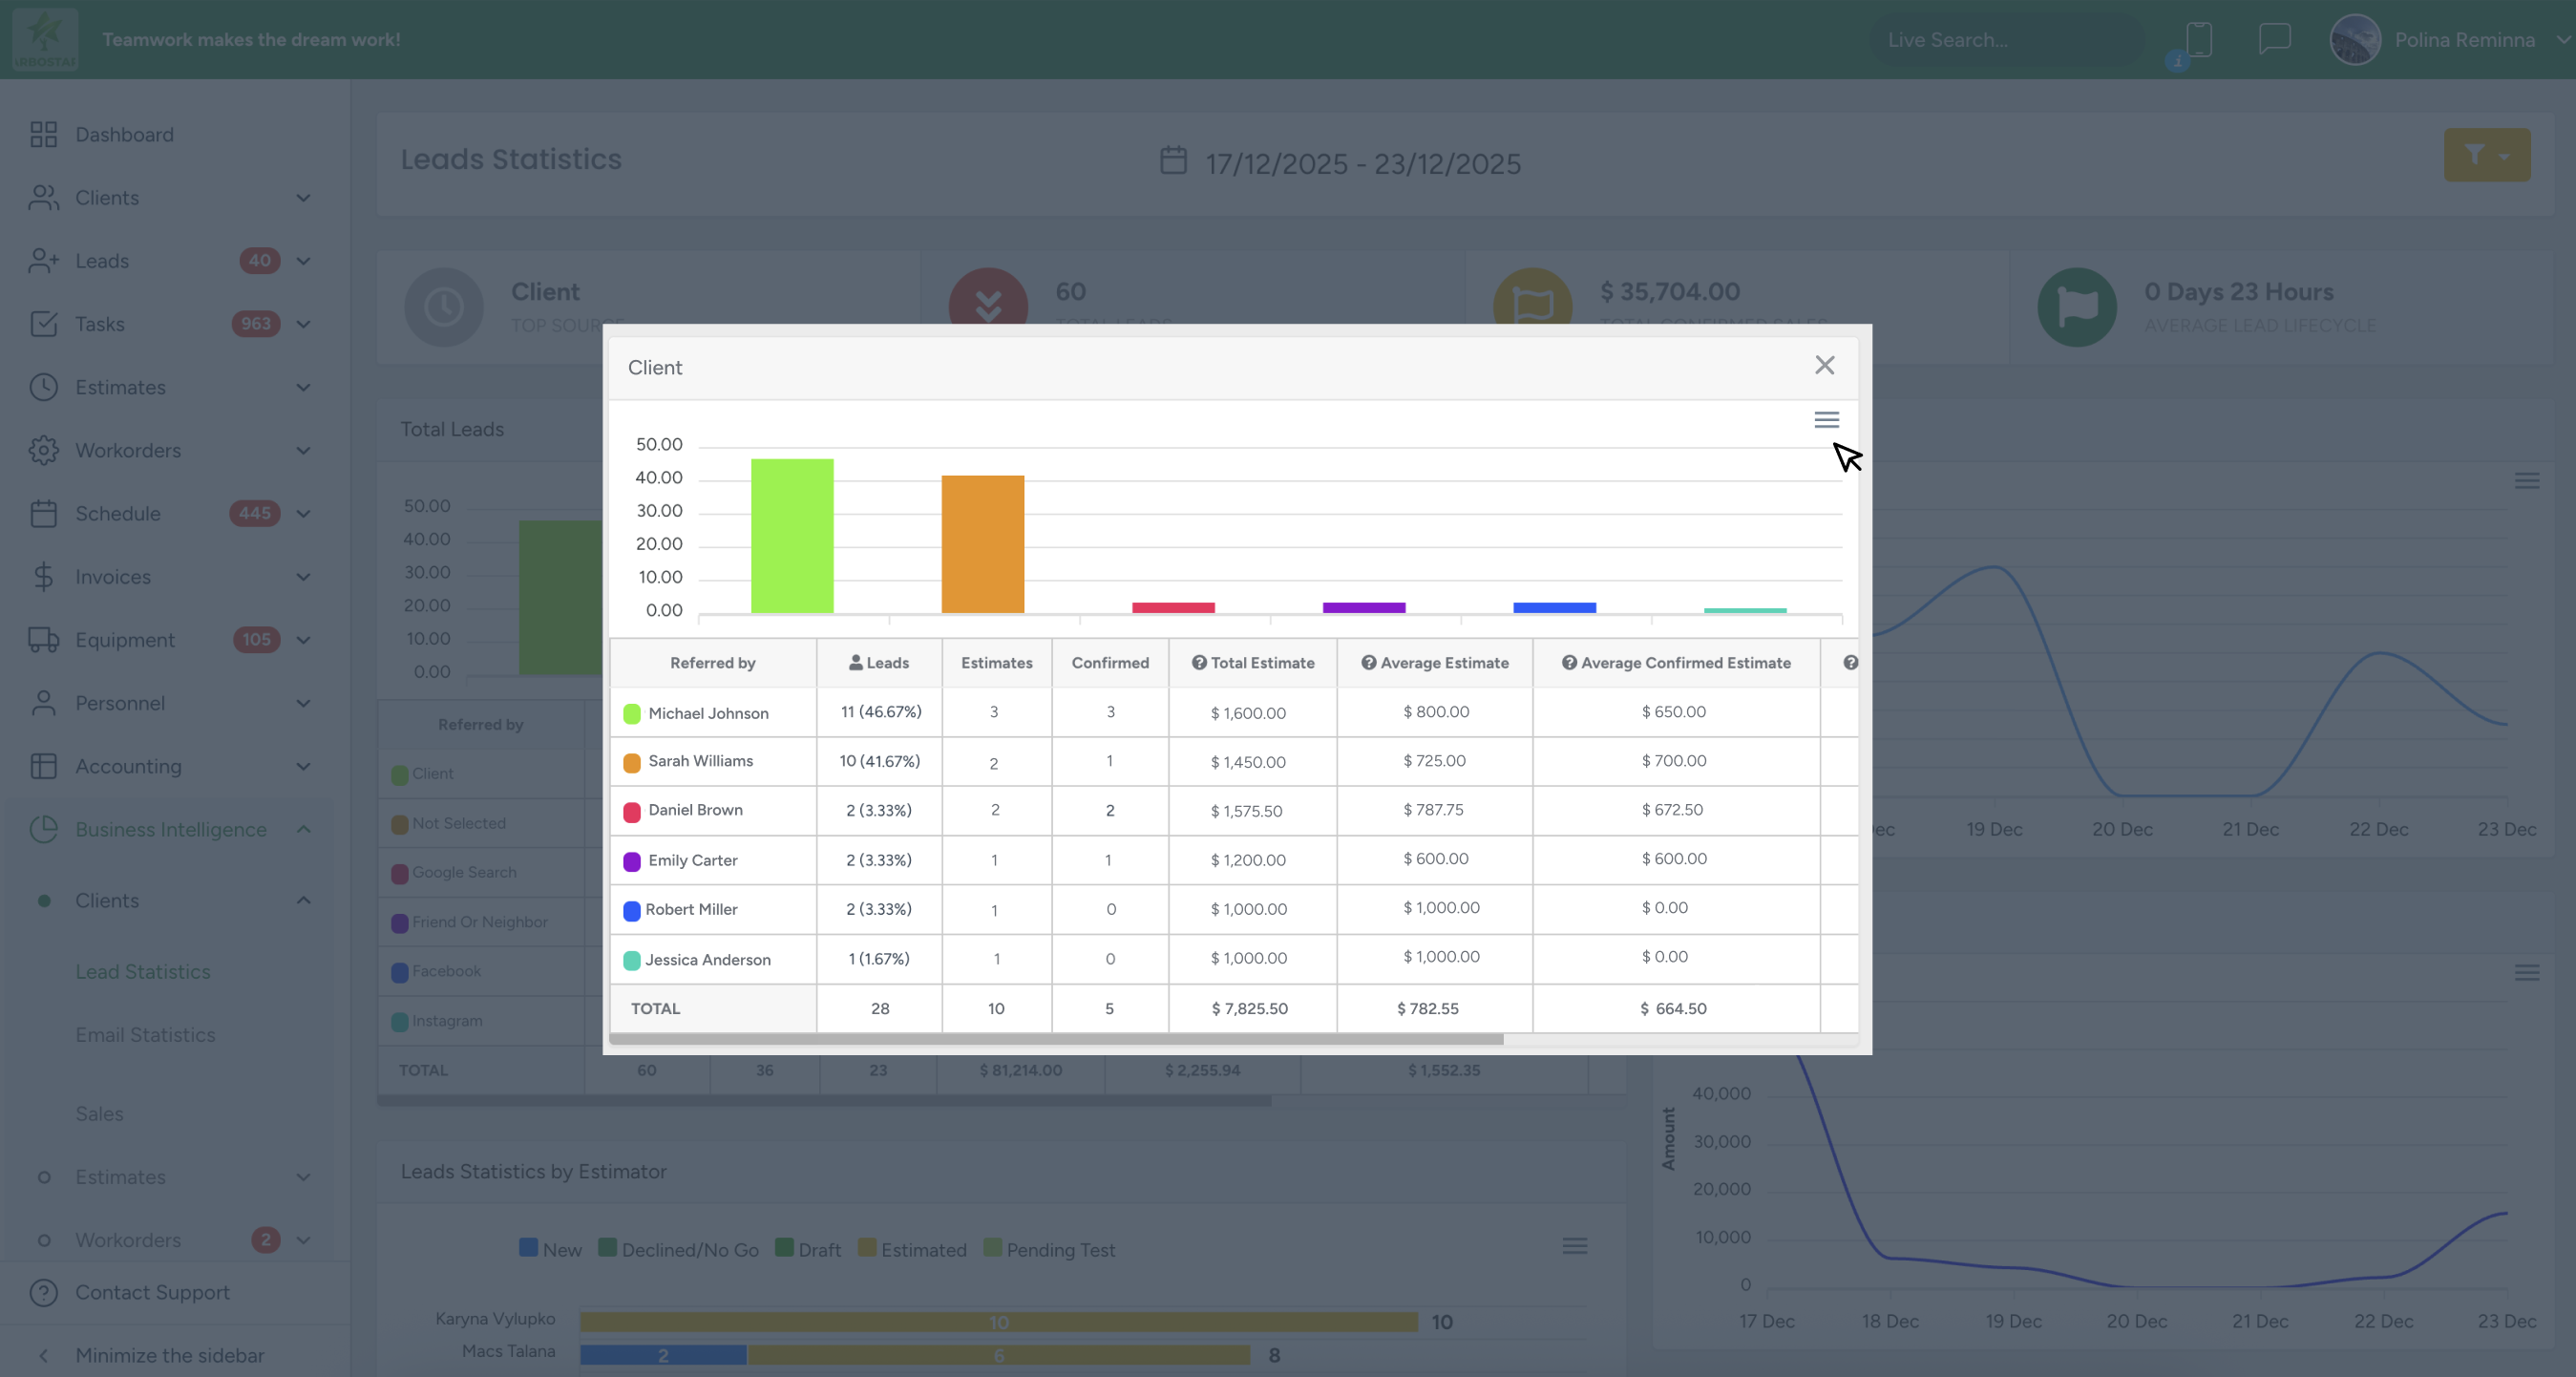
When you click a clickable Lead Source row (it will be highlighted with an underscore):
A drill-down modal window opens.
The modal title matches the selected Lead Source (for example: Client, Employee, Other).
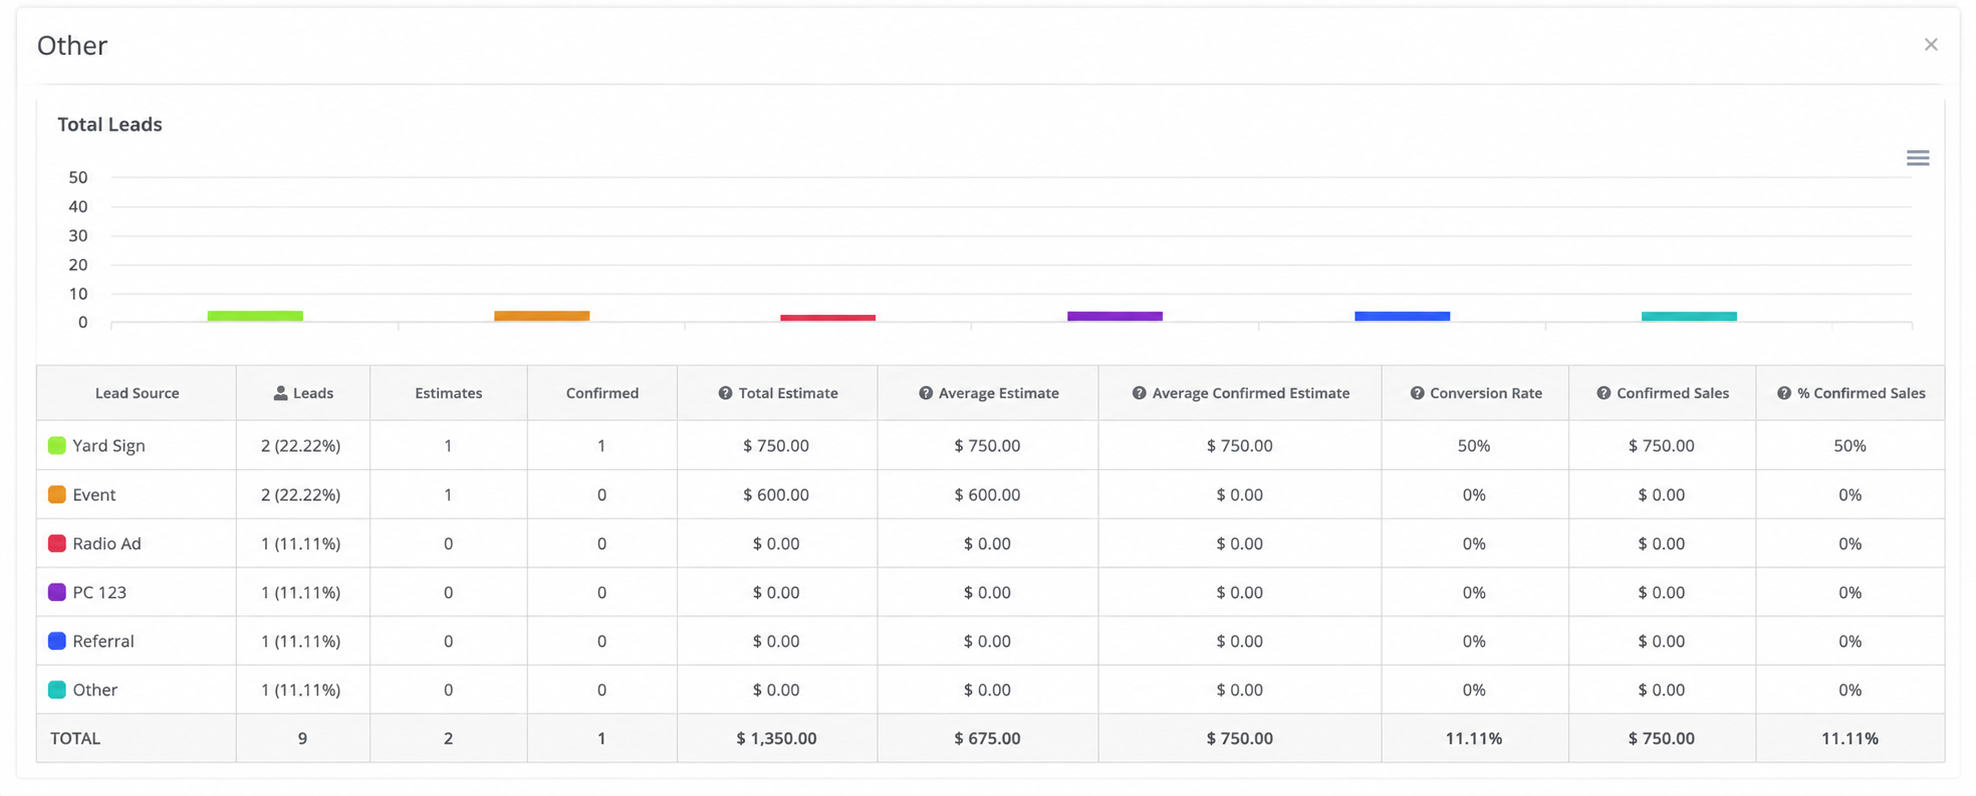
Inside the drill down modal, the data is grouped differently depending on the Lead Source:
Client → grouped by individual clients
Employee → grouped by individual employees
Custom Lead Source with details enabled → grouped by Lead Source Details (custom text entered when the lead was created)
This allows you to analyze performance in greater detail, while the drill down table maintains the same interactive behavior as the main table — the Leads column opens the related leads list, and the Confirmed column opens the corresponding confirmed estimates list.
In the Total Leads chart (both in the main view and in the drill down), the Y-axis displays percentages and is always limited to a maximum of 100%, ensuring clear and accurate visualization without values exceeding 100%.
Both the main Total Leads chart and the drill down chart support export options:
Download SVG — exports the chart as an SVG image
Download PNG — exports the chart as a PNG image
Download CSV — exports the data shown in the table below the chart
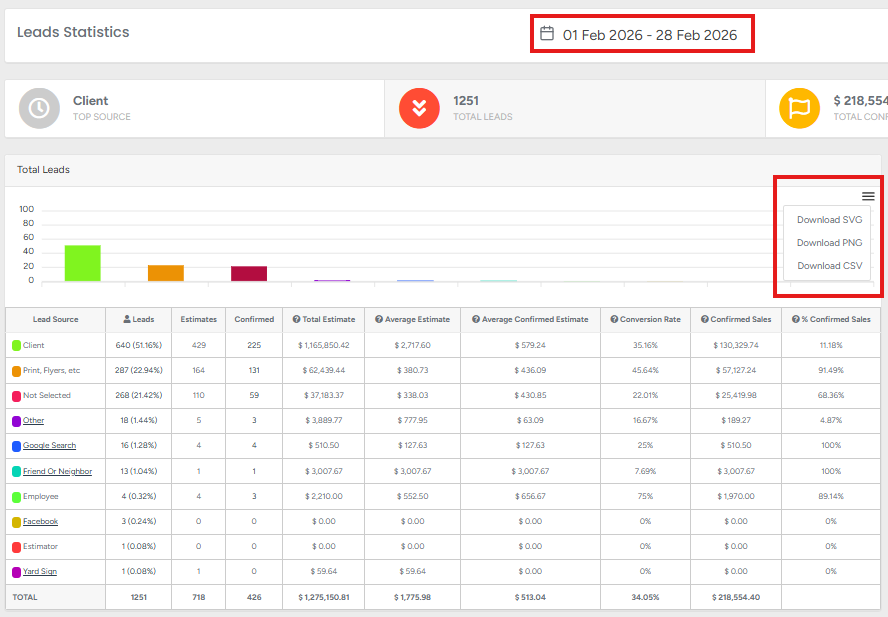
Lead Statistics — Key Metrics
% Leads — the top three Lead Sources represent the most common sources selected when creating a lead at the client’s first contact.
👤 Leads — number of leads per source and total.
Click any number to view a list of client names.
Clicking a client name redirects to the client’s profile.
Conf. (Confirmed Estimates) — number of leads that converted into confirmed estimates.
Click any number to view the estimate number.
Clicking a number redirects to the specific estimate.
Estimate — number of estimates generated from the total leads.
Total Estimate — sum of all estimates in the selected currency.
Conversion Rate — ratio of confirmed estimates to total leads.
Conf. Sales — total value of confirmed sales.
Scroll horizontally to view additional columns.
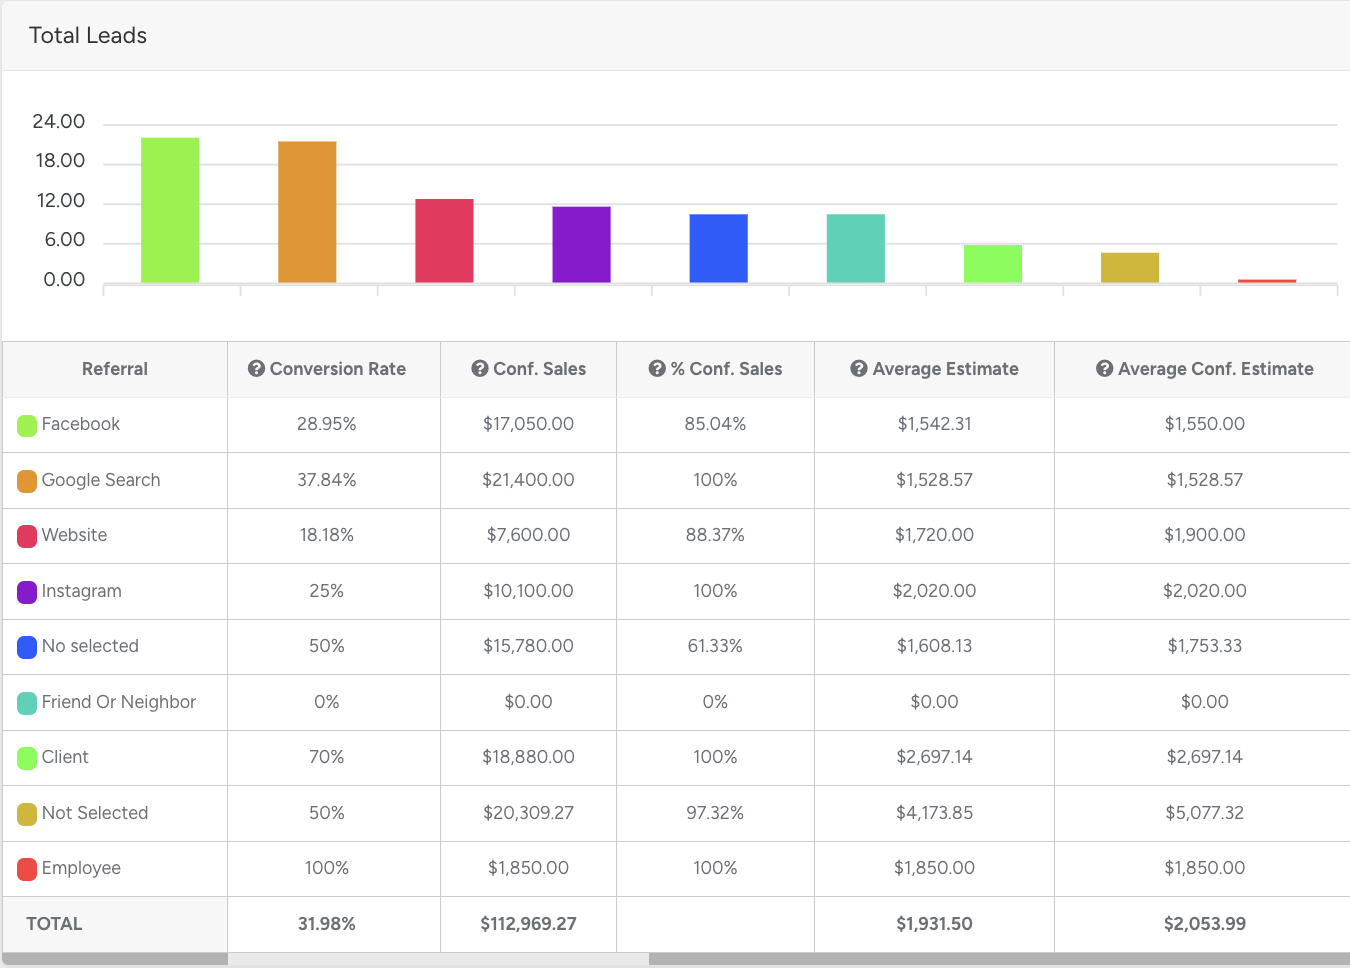
% Conf. Sales — ratio of confirmed sales to total estimate.
Average Estimate — average value of all estimates in the selected currency.
Average Conf. Estimate — average value of confirmed estimates in the selected currency.
Charts
On the right side of the screen, three charts provide visual insights into lead performance:
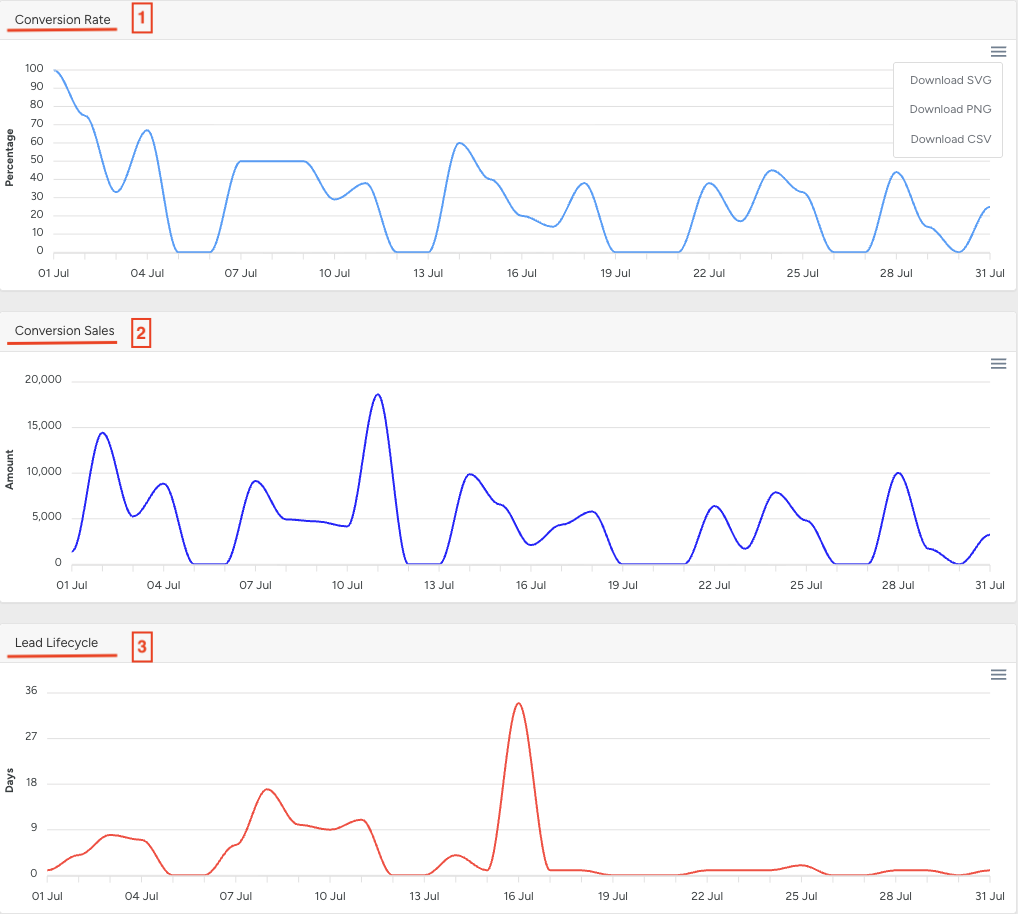
Conversion Rate — percentage of confirmed estimates vs. total leads over time.
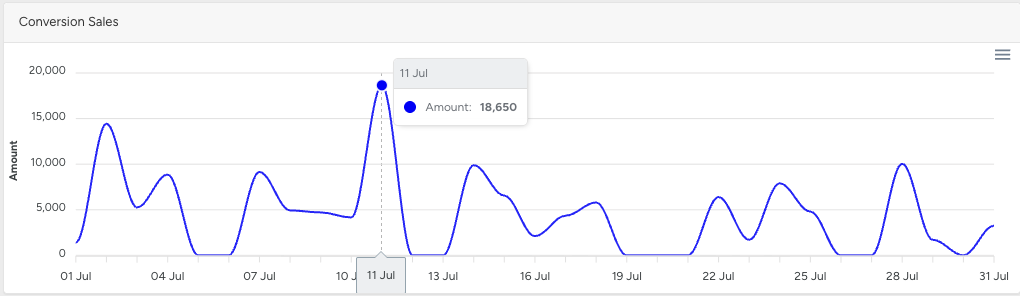
Confirmed Sales — total revenue from converted leads over time.
Lead Lifecycle — average number of days from lead creation to confirmed estimate.
Hover over any point on a chart to view the exact date and value.
The three-line menu in the upper-right corner allows exporting charts in SVG, PNG, or CSV format.
Together, these charts provide a complete visual overview of lead performance, conversion efficiency, and sales pipeline speed.
Lead Status Dashboard
- Lead Status — distribution of leads across different statuses (e.g., New, Estimated, Appointment Scheduled, Draft, No Go).
Confirmed Sales
- Shows the percentage breakdown of confirmed sales by Lead Source Details (for example, Facebook, Google Search, Website, or Client). You can use the three-line menu in the top-right corner to download the report as an SVG, PNG, or CSV file. All numbers in the drill-down view, including confirmed counts, percentages, totals, and averages, are calculated using the same filters and date range selected on the main Lead Statistics page, so the detailed view always matches the summary.
You can export data from both the main Confirmed Sales report and the drill-down view as SVG or PNG chart images, or as a CSV file. The CSV export will contain exactly the data currently displayed on the screen, based on the selected Lead Source, applied filters, and chosen date range.
To export the report, click the three-bars icon in the top-right corner of the chart.
In the Confirmed Sales table, you can click certain Lead Sources to view more detailed information — Client and Employee are always clickable, while other Lead Sources are clickable only if they are configured to allow additional details; if a Lead Source is not clickable, it will remain static and will not open a detailed view.
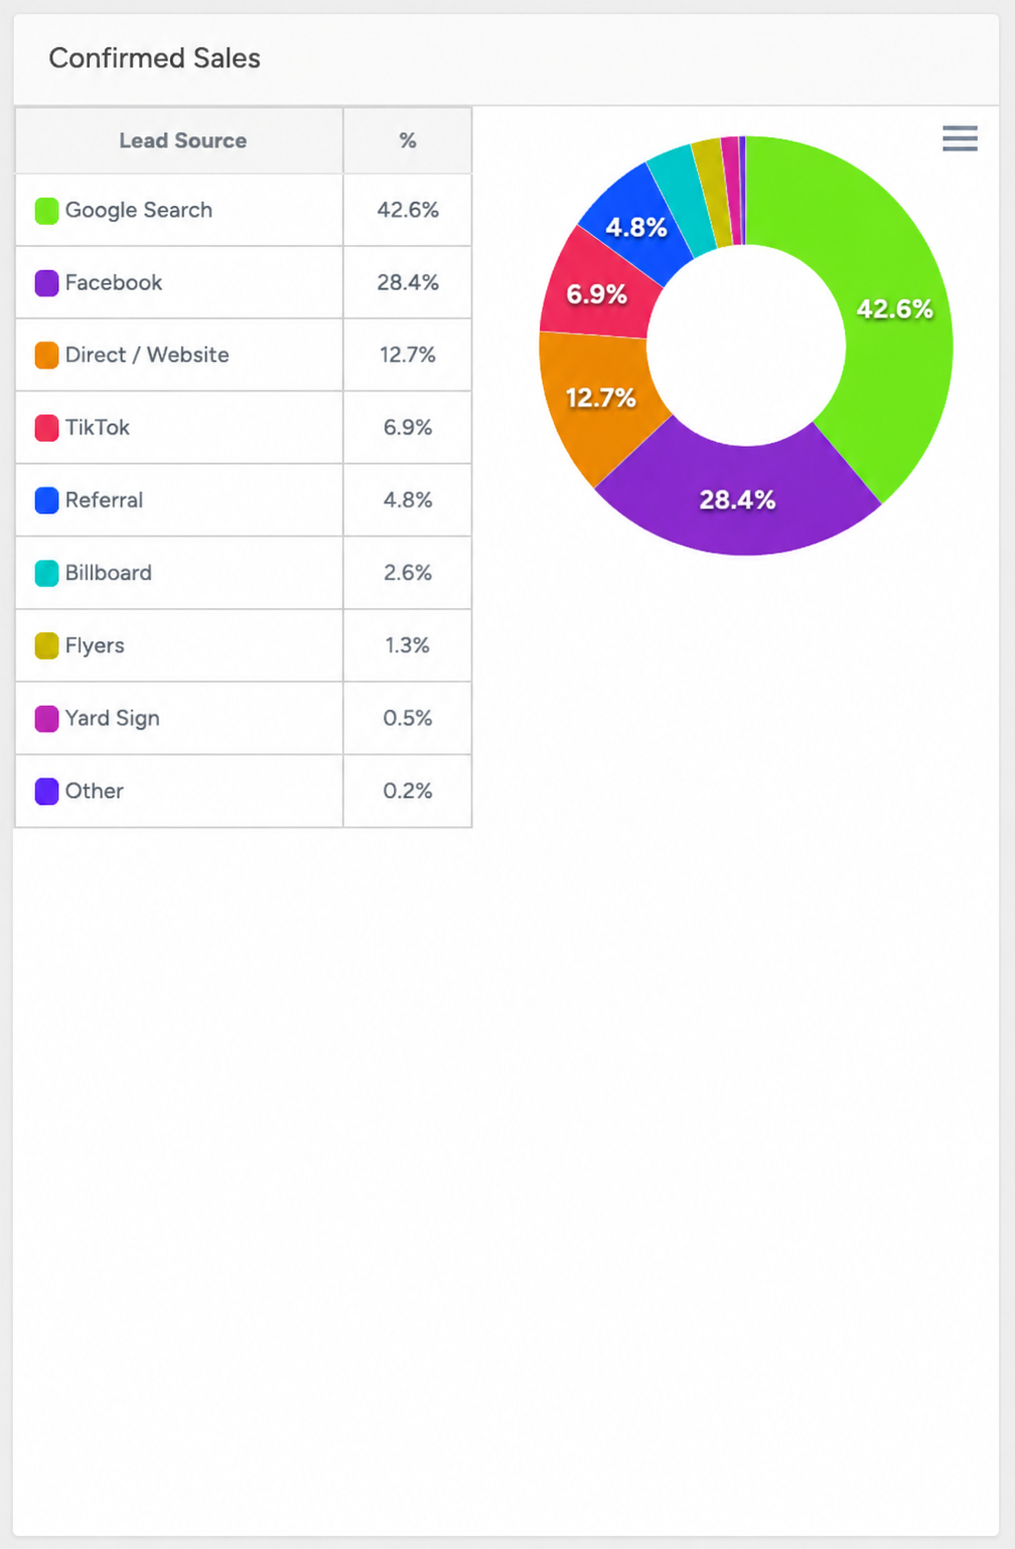
Each segment is interactive: click to highlight a category.
Lead Services
Below the pie charts on the left side of the screen, the Lead Services chart is displayed.
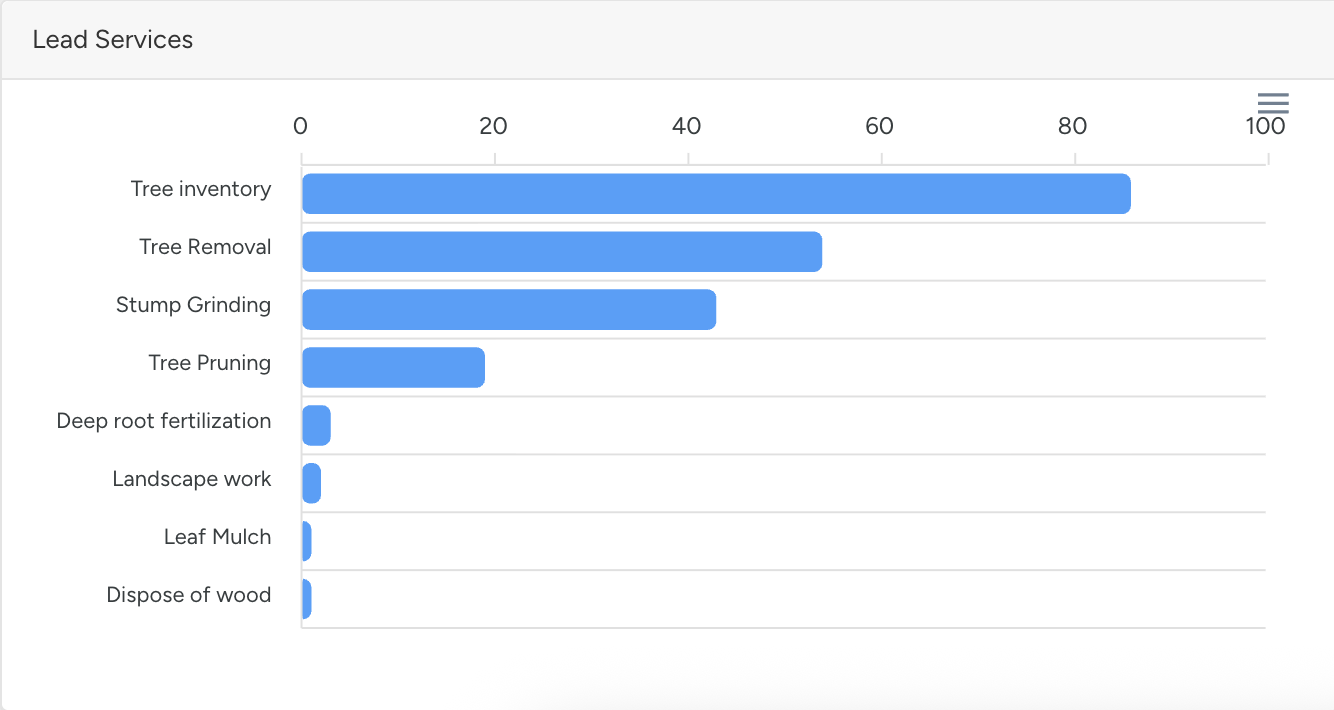
Vertical axis — list of services
Horizontal axis — quantity of leads per service
Hovering over a bar reveals the exact number of leads.
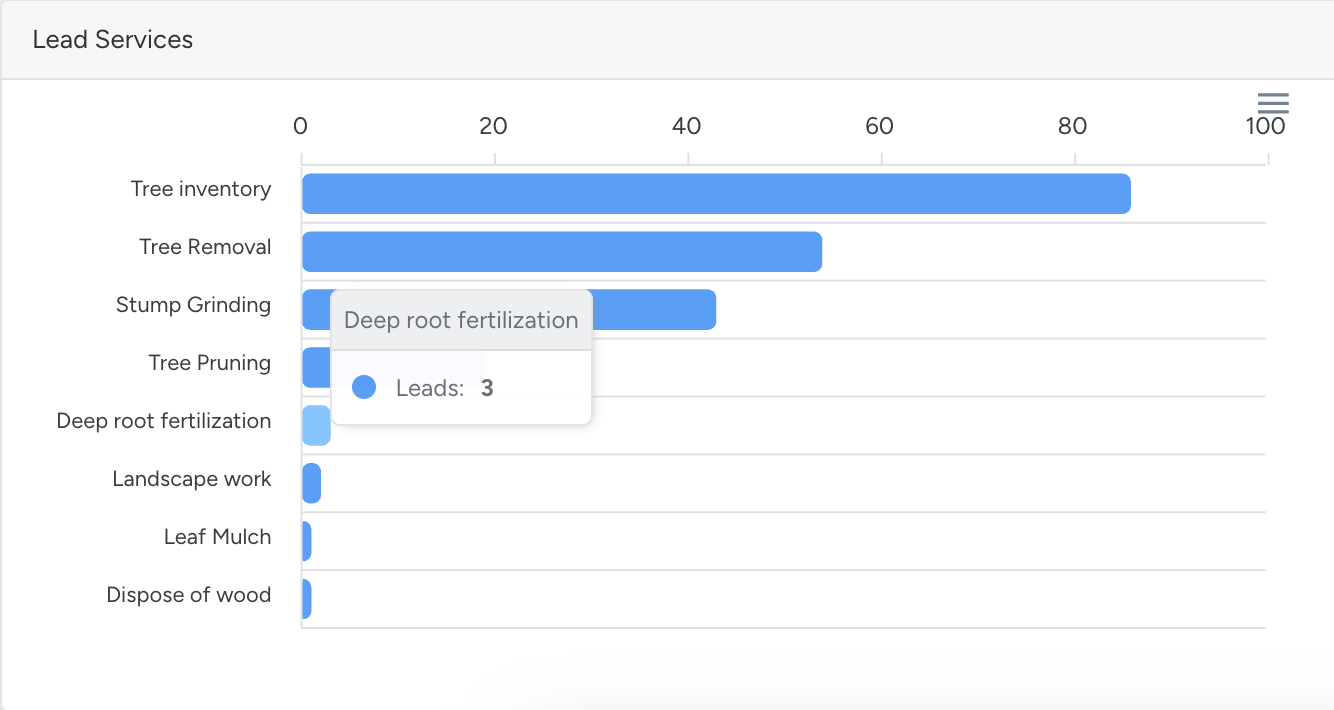
The three-line menu in the top-right corner allows exporting the chart in SVG, PNG, or CSV formats.
Google Click ID and Form ID Tracking
Lead Statistics can also include marketing attribution data such as:
- Google Click ID (GCLID)
- Form ID
- UTM parameters
These tracking values help businesses understand:
- Which ads generated leads
- Which forms customers submitted
- Which campaigns are performing best
- Where leads are coming from
This information can help improve:
- Marketing ROI
- Campaign analysis
- Lead source tracking
- Advertising performance reporting
Marketing details can be viewed inside:
- Requests
- Leads
- Lead Statistics
- CSV exports
Click here to learn more about Google Click ID and Form ID tracking.
The Lead Statistics module provides a centralized, interactive, and visual way to track the entire lead journey — from initial Lead Source Details to confirmed sales. With filters, marketing attribution data, detailed metrics, and downloadable reports, businesses can analyze lead sources, campaign performance, Google Click IDs, Form IDs, and sales activity to make more informed marketing and operational decisions.