
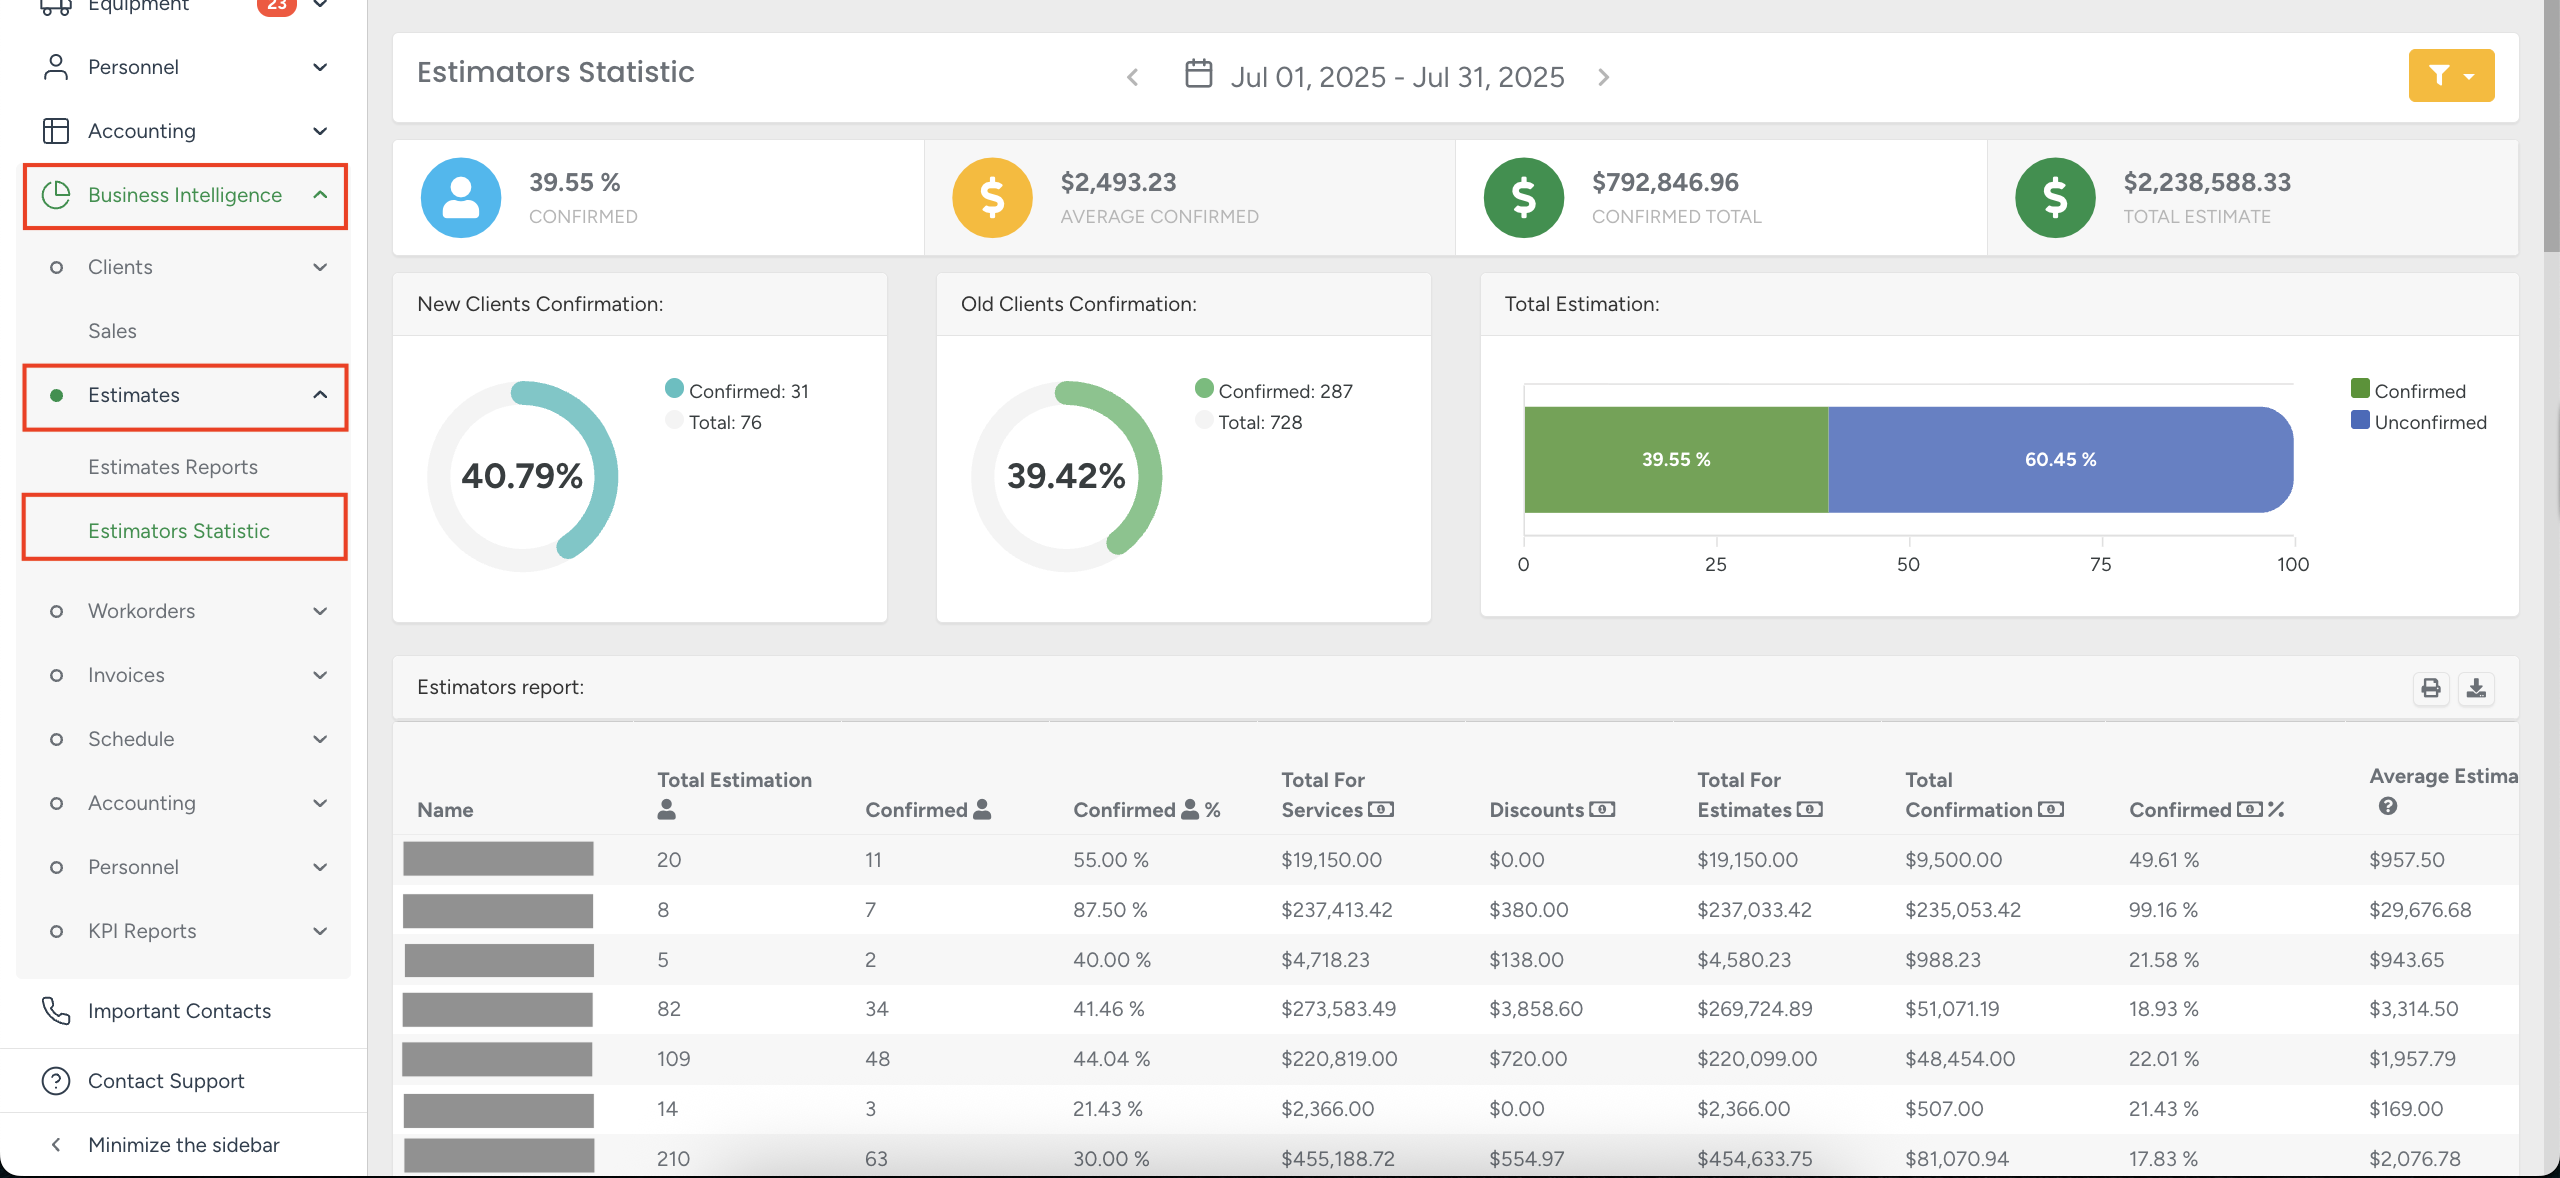
Estimator Performance Overview
The Estimator Statistics module provides detailed analytics on estimator reports, employee MHR return, and estimator MHR return. It allows evaluation of individual estimator performance over a selected period, review of overall company effectiveness, and analysis of man-hour rate (MHR) returns across both estimators and employees.
Access path: Business Intelligence → Estimates → Estimator Statistics
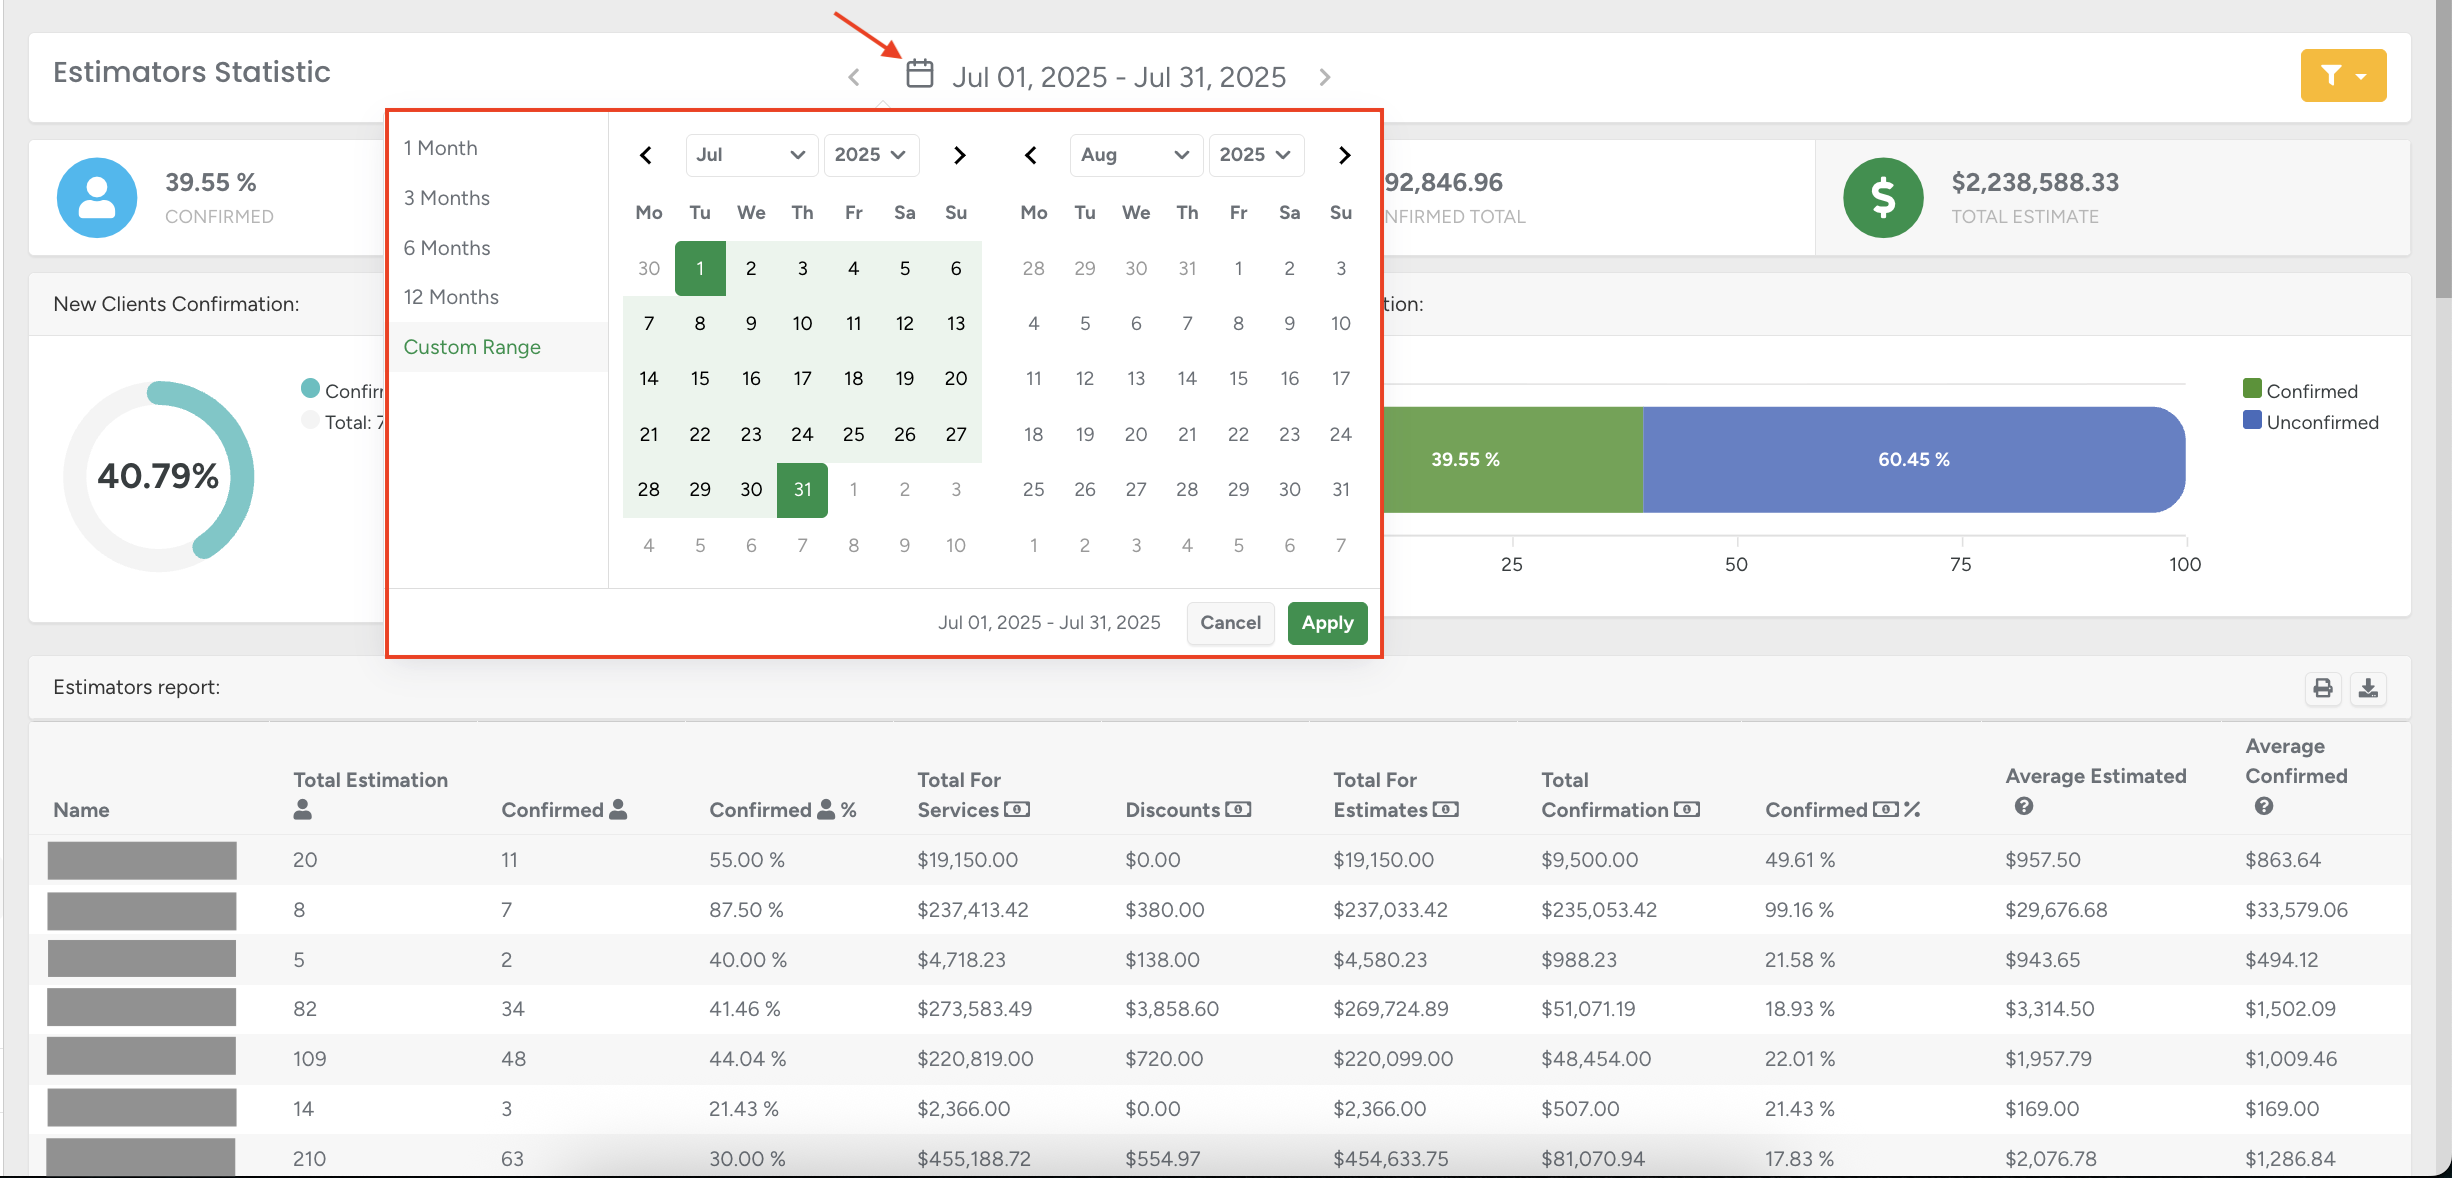
Date Selection
A specific date range may be selected by clicking the calendar icon.
Filters
Results can be refined using the following filters:
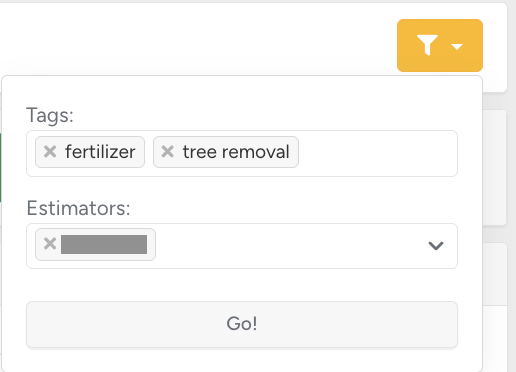
Tags
Estimators
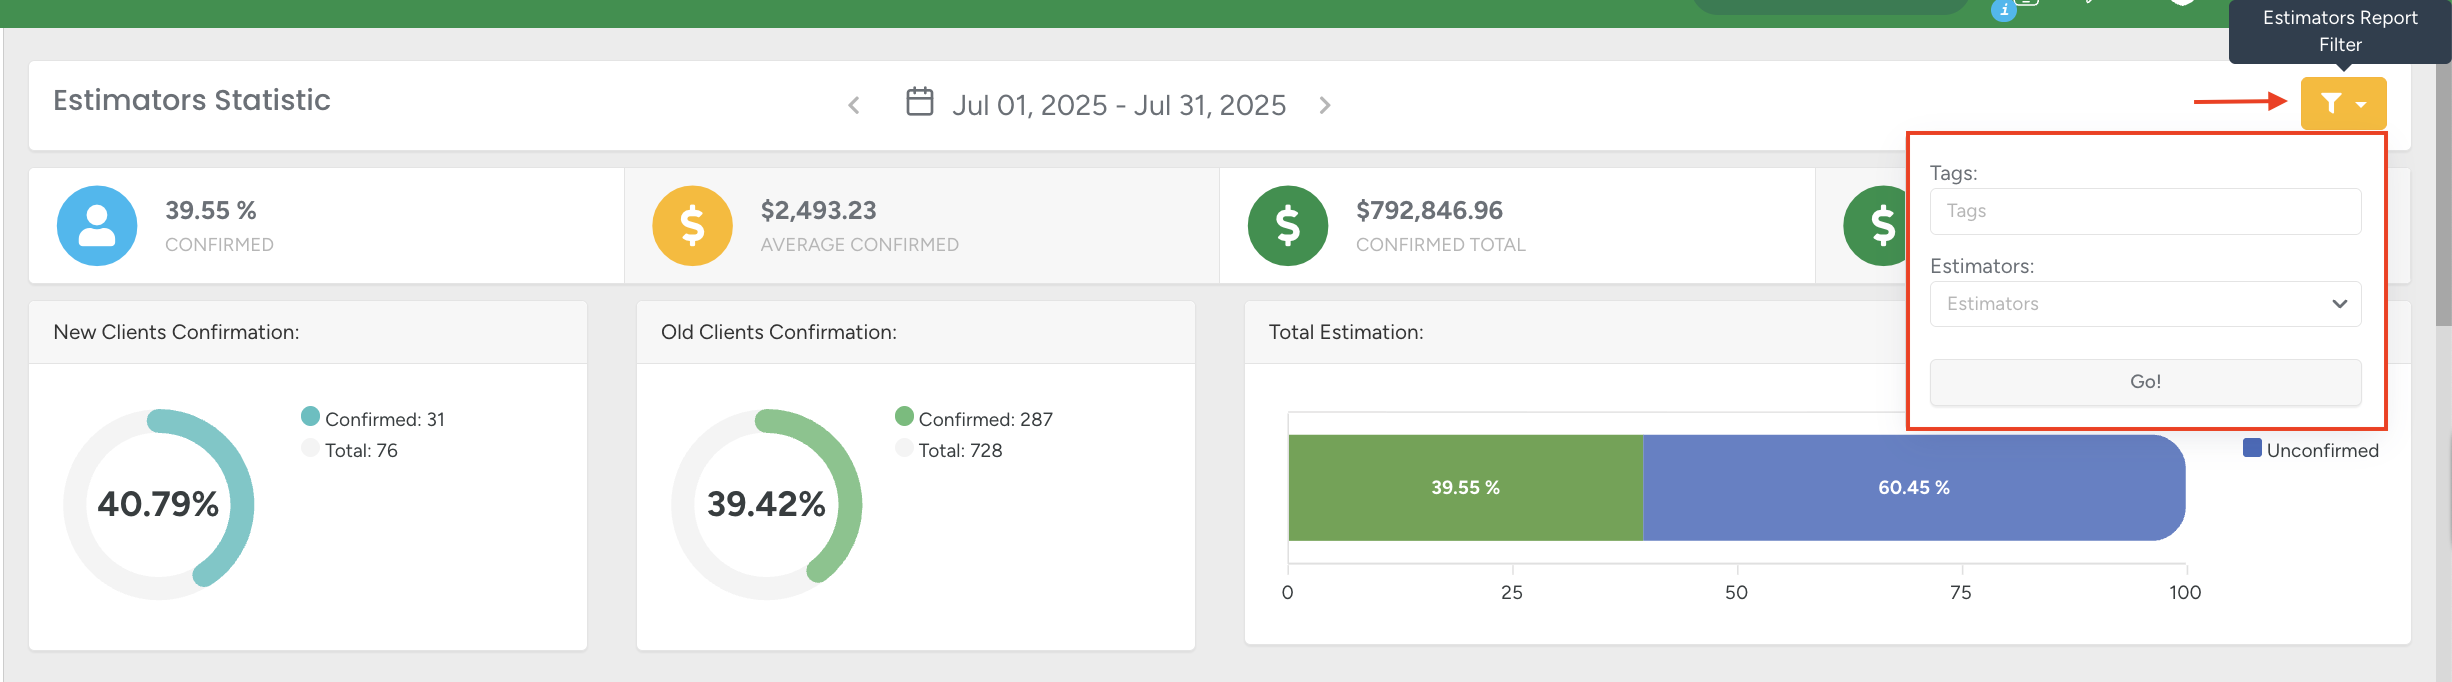
Multiple selections are available in both filters. After selecting the desired options, click Go! to apply them.
Dashboard Summary
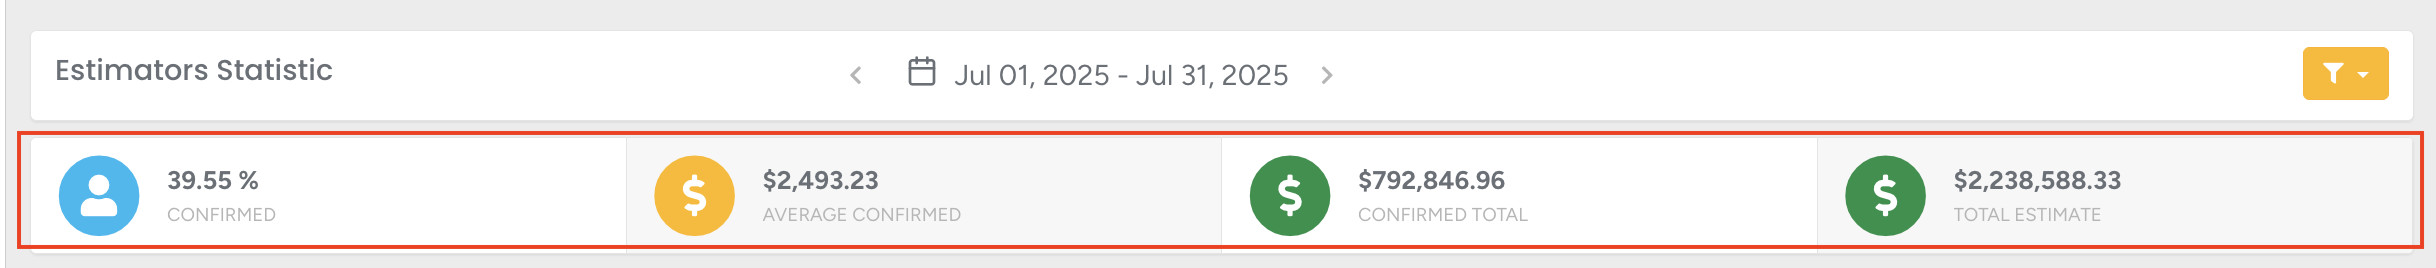
The dashboard highlights four key metrics:
Confirmed — percentage of confirmed estimates for the selected period.
Average Confirmed — average value of confirmed estimates in the selected currency.
Confirmed Total — total value of confirmed estimates in the selected currency.
Total Estimate — overall value of all estimates in the selected currency.
Client Confirmation and Estimation Overview
This section provides a visual overview of confirmations and estimations for both new and returning clients.
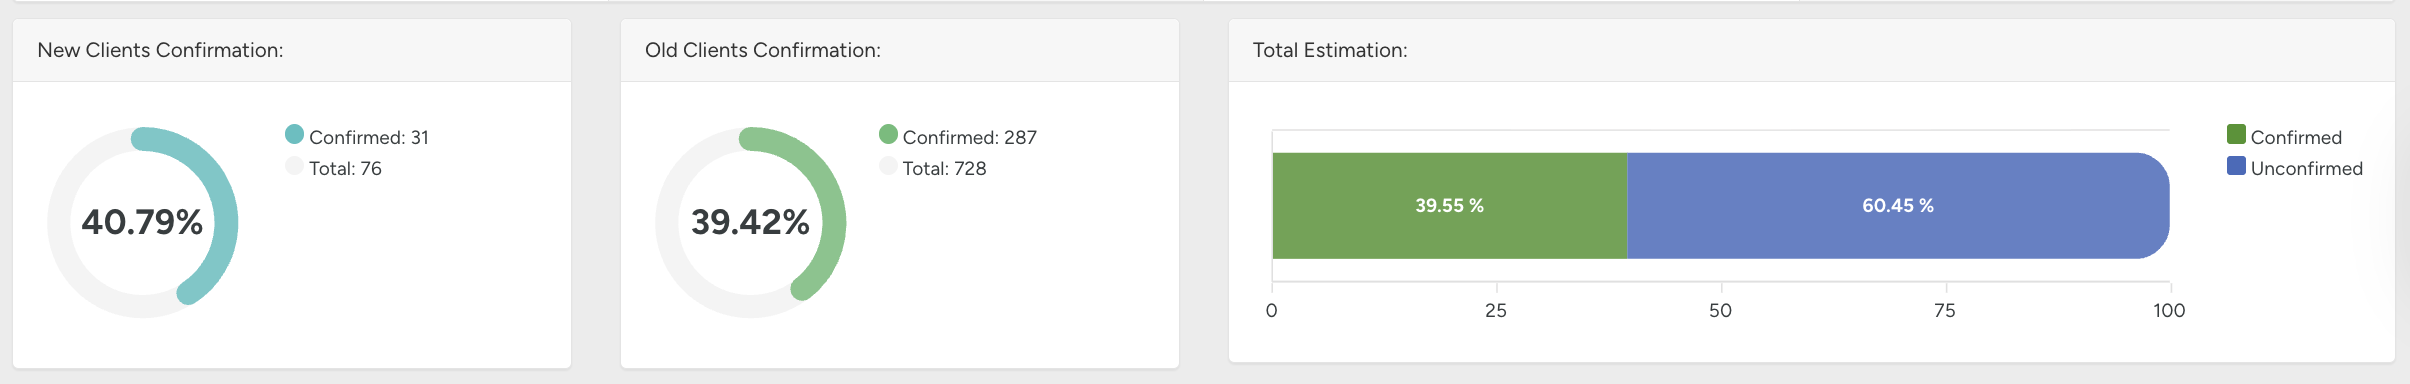
New Clients Confirmation — ring chart displaying total estimates for new clients and the share confirmed.
Old Clients Confirmation — ring chart displaying total estimates for returning clients and the share confirmed.
Total Estimations — bar chart illustrating the percentage of confirmed vs. not confirmed estimates for all clients, with each category distinguished by color.
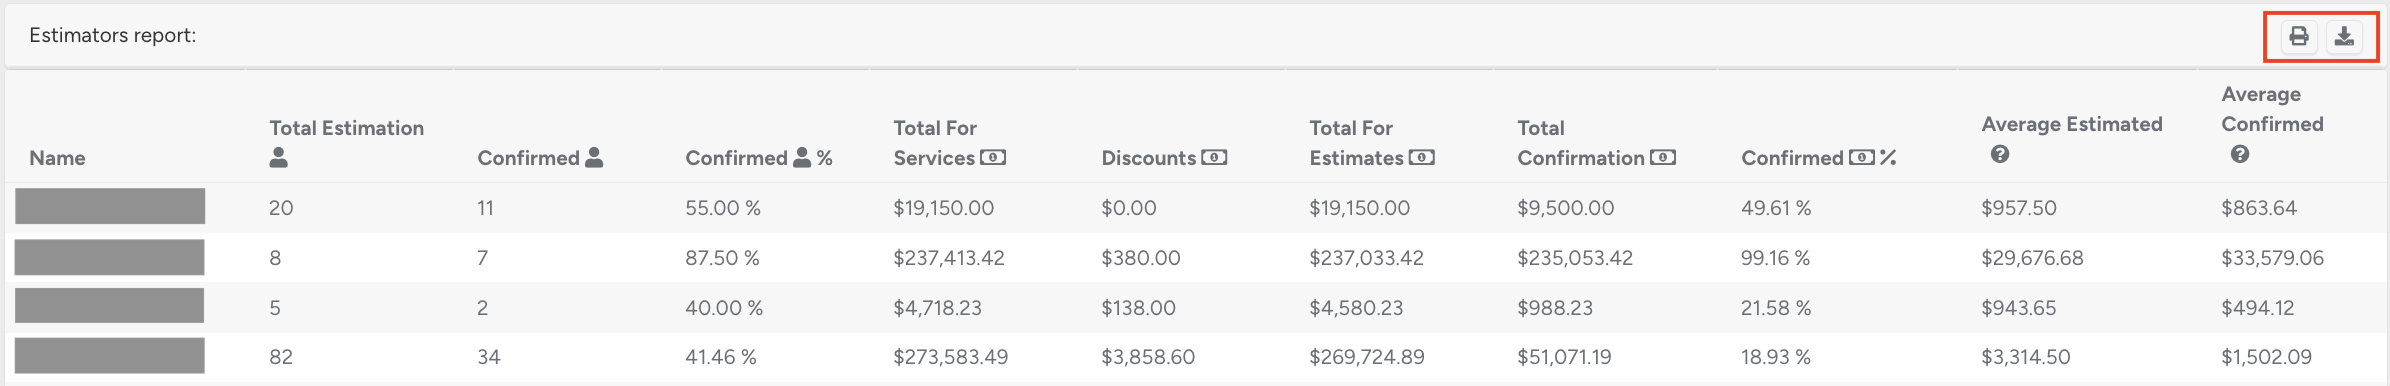
Estimators Report — Key Metrics
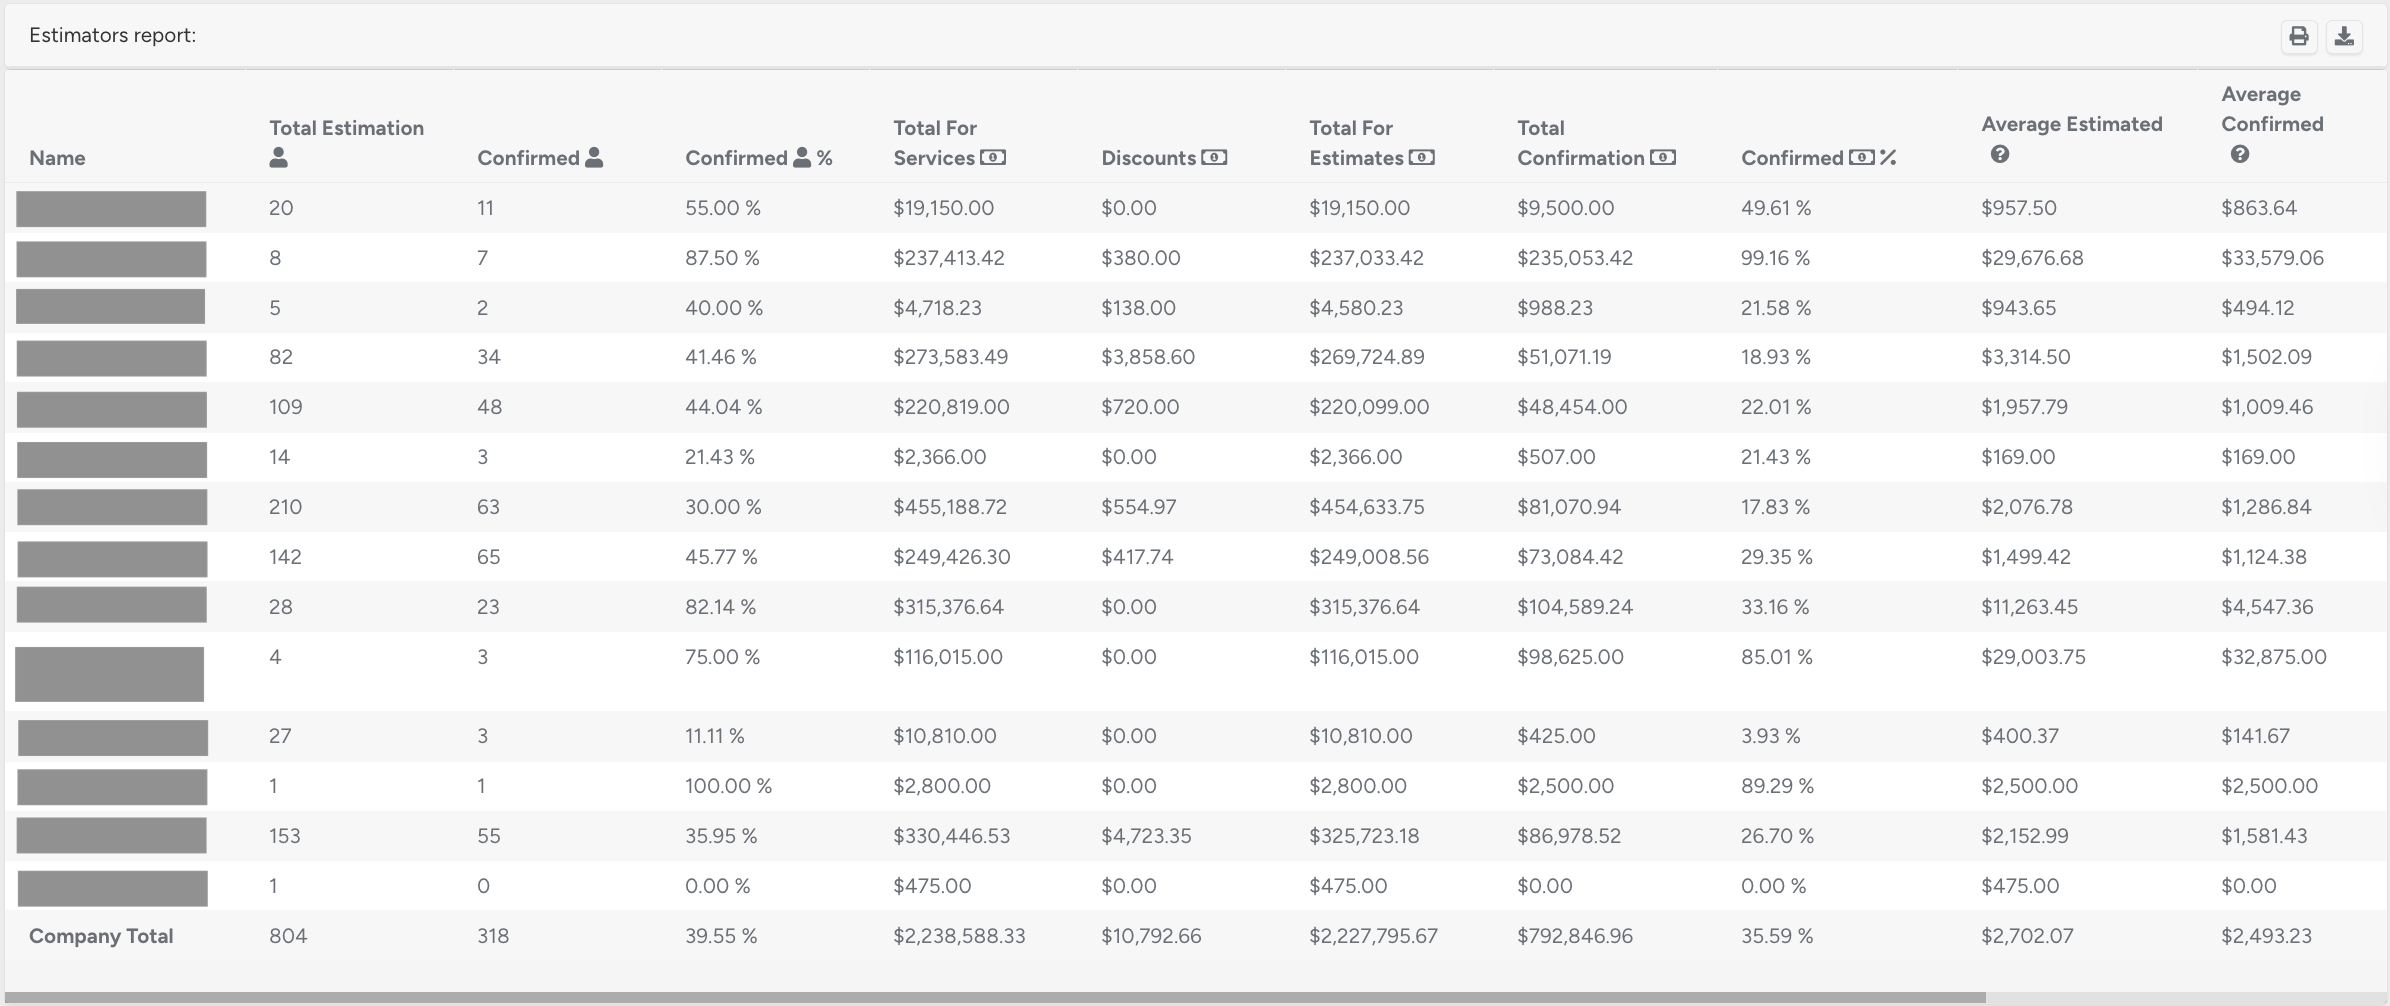
This section presents detailed performance metrics for each estimator. All values are shown individually per estimator and as a company total.
Name — estimator’s name
Total Estimations — number of created estimates
Confirmed — number of confirmed estimates
Confirmed % — percentage of confirmed estimates out of total
Total for Services — total amount of paid services
Discounts — total amount of discounts applied
Total for Estimates — overall value of all estimates
Total Confirmation — total value of confirmed estimates
Confirmed % — share of confirmed estimates as a percentage of Total for Services
Average Estimated — average value of all created estimates (Total for Services ÷ Total Estimations)
Average Confirmed — average value of confirmed estimates (Total Confirmation ÷ Confirmed)
Scroll horizontally to view additional columns.
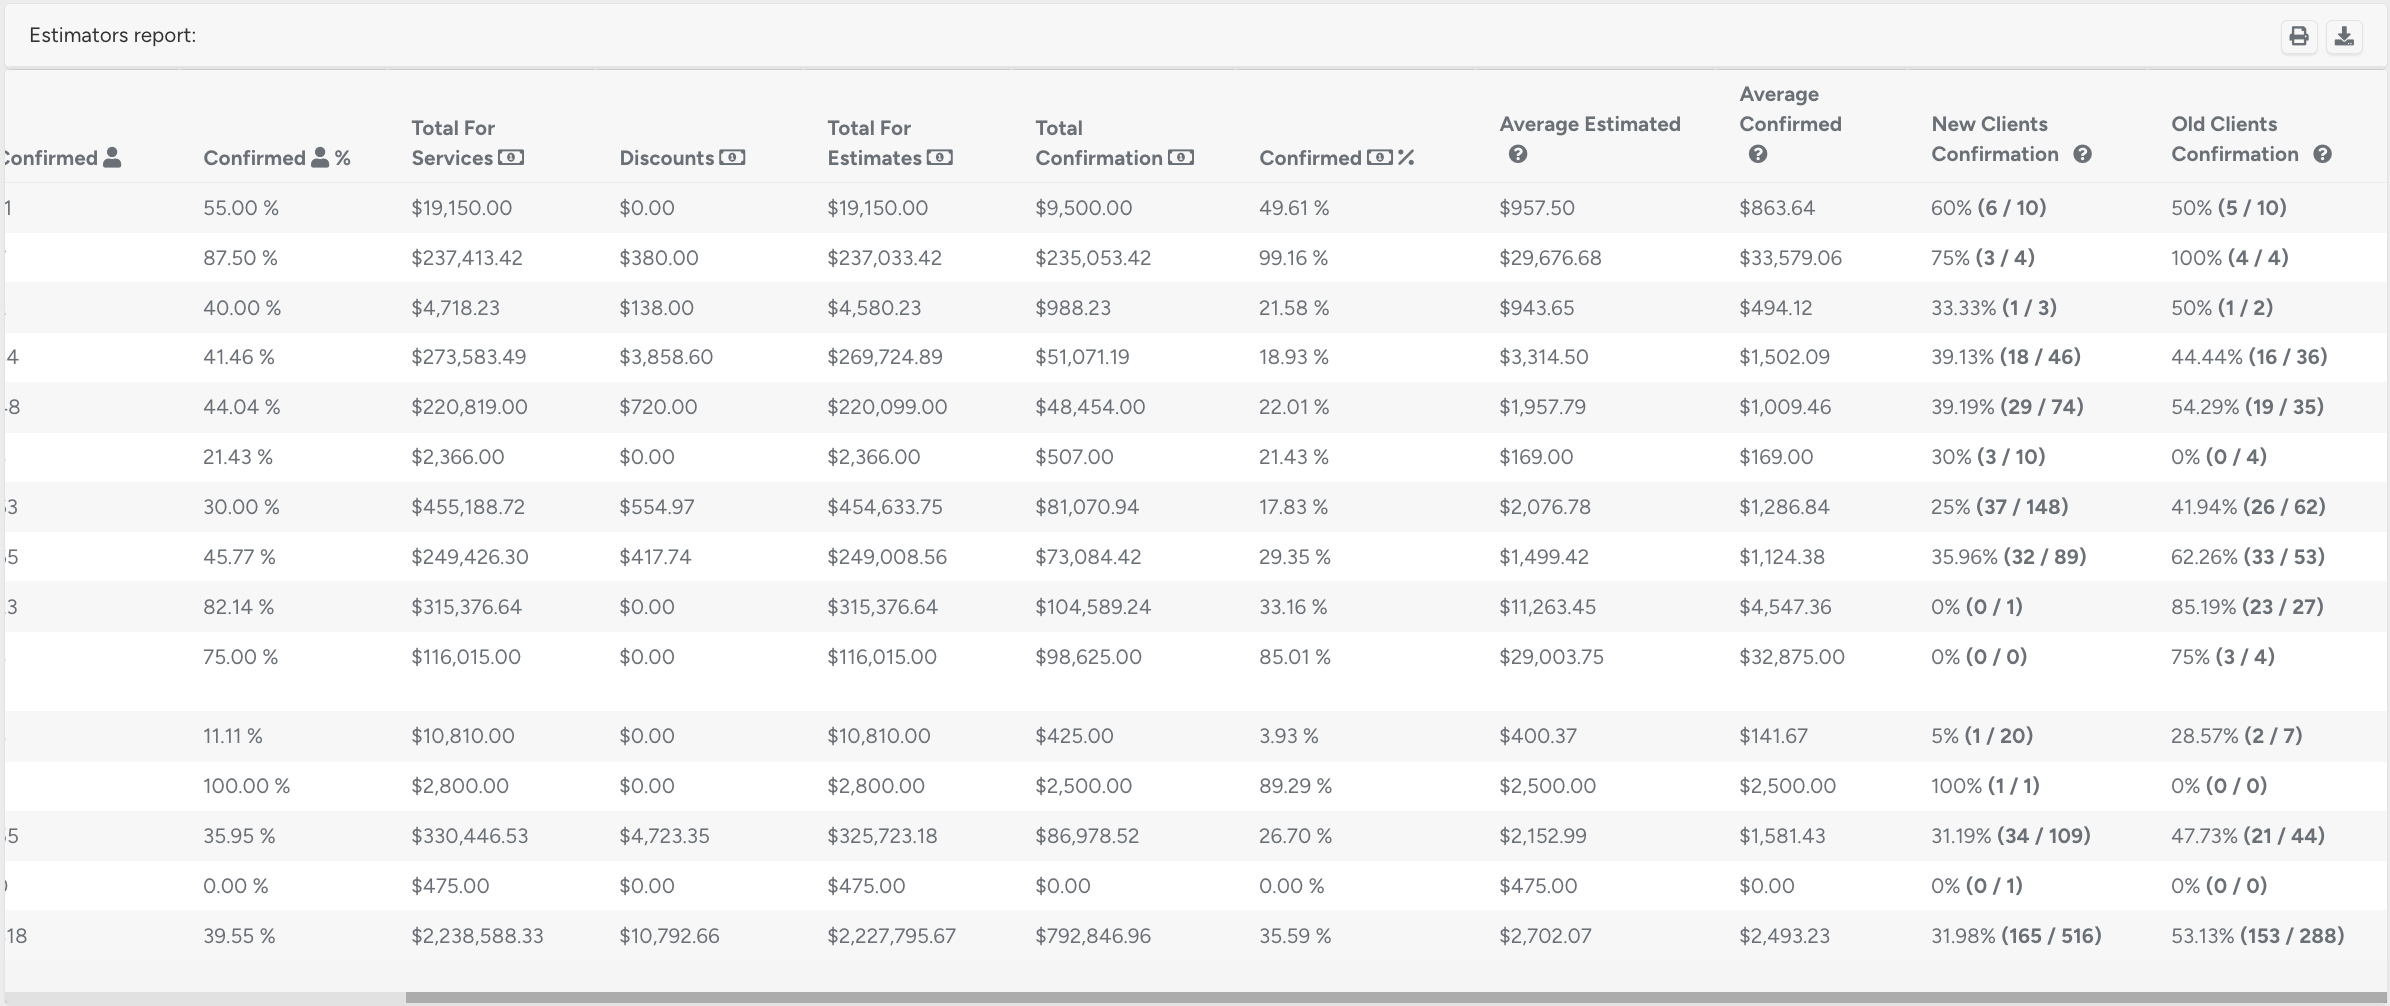
New Client Confirmation — percentage of confirmed estimates for new clients
Old Client Confirmation — percentage of confirmed estimates for returning clients
Estimator reports can be exported in PDF or CSV format using the menu in the upper-right corner.
Confirmed report
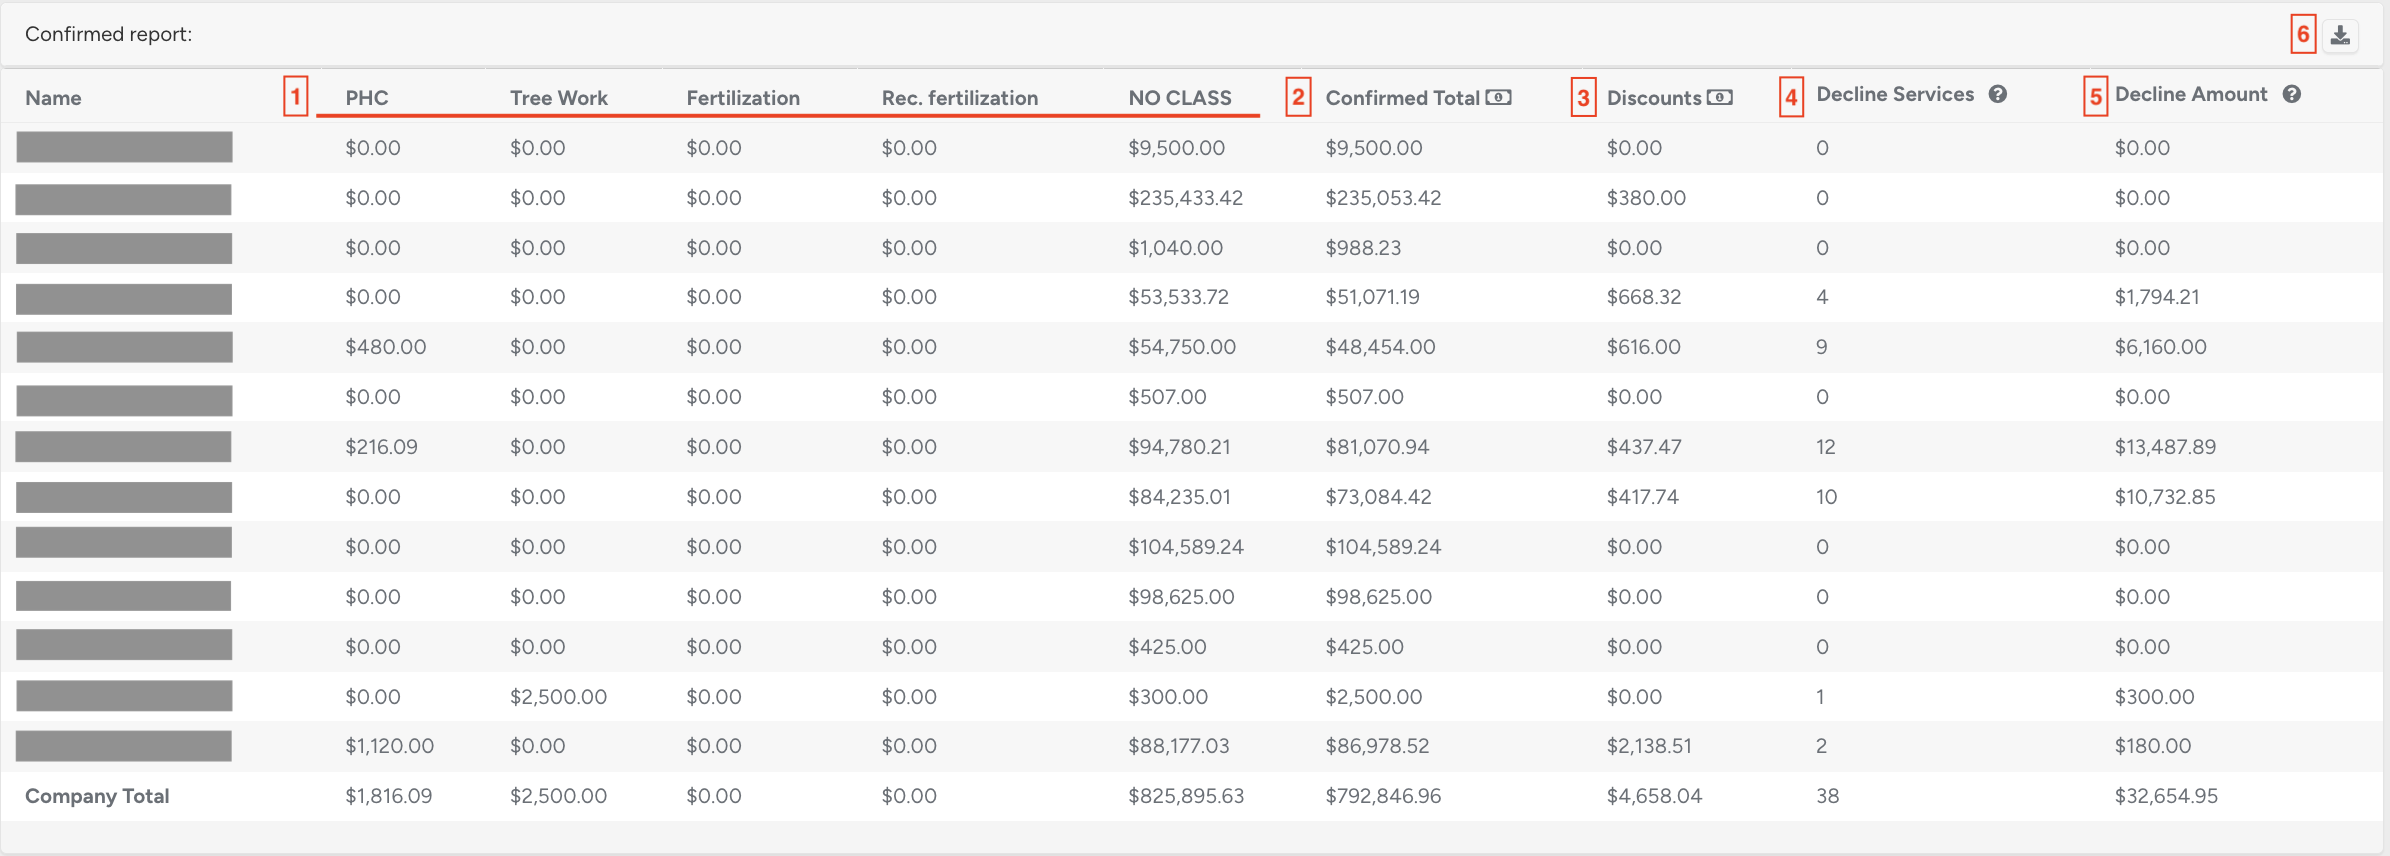
The first column displays the Estimator Name.
Classes of Estimates — categories of estimates.
Confirmed Total — total value of confirmed estimates.
Discounts — total amount of discounts applied.
Declined Services — number of services with status Canceled.
Declined Amount — total value of services with status Canceled.
Export — confirmed reports may be exported in CSV format using the export button.
Employees’ / Estimators’ MHR Return
The MHR Return report displays key performance metrics for field workers and estimators, measured by man-hour return (MHR). Separate tables are available for employees (field workers) and estimators.
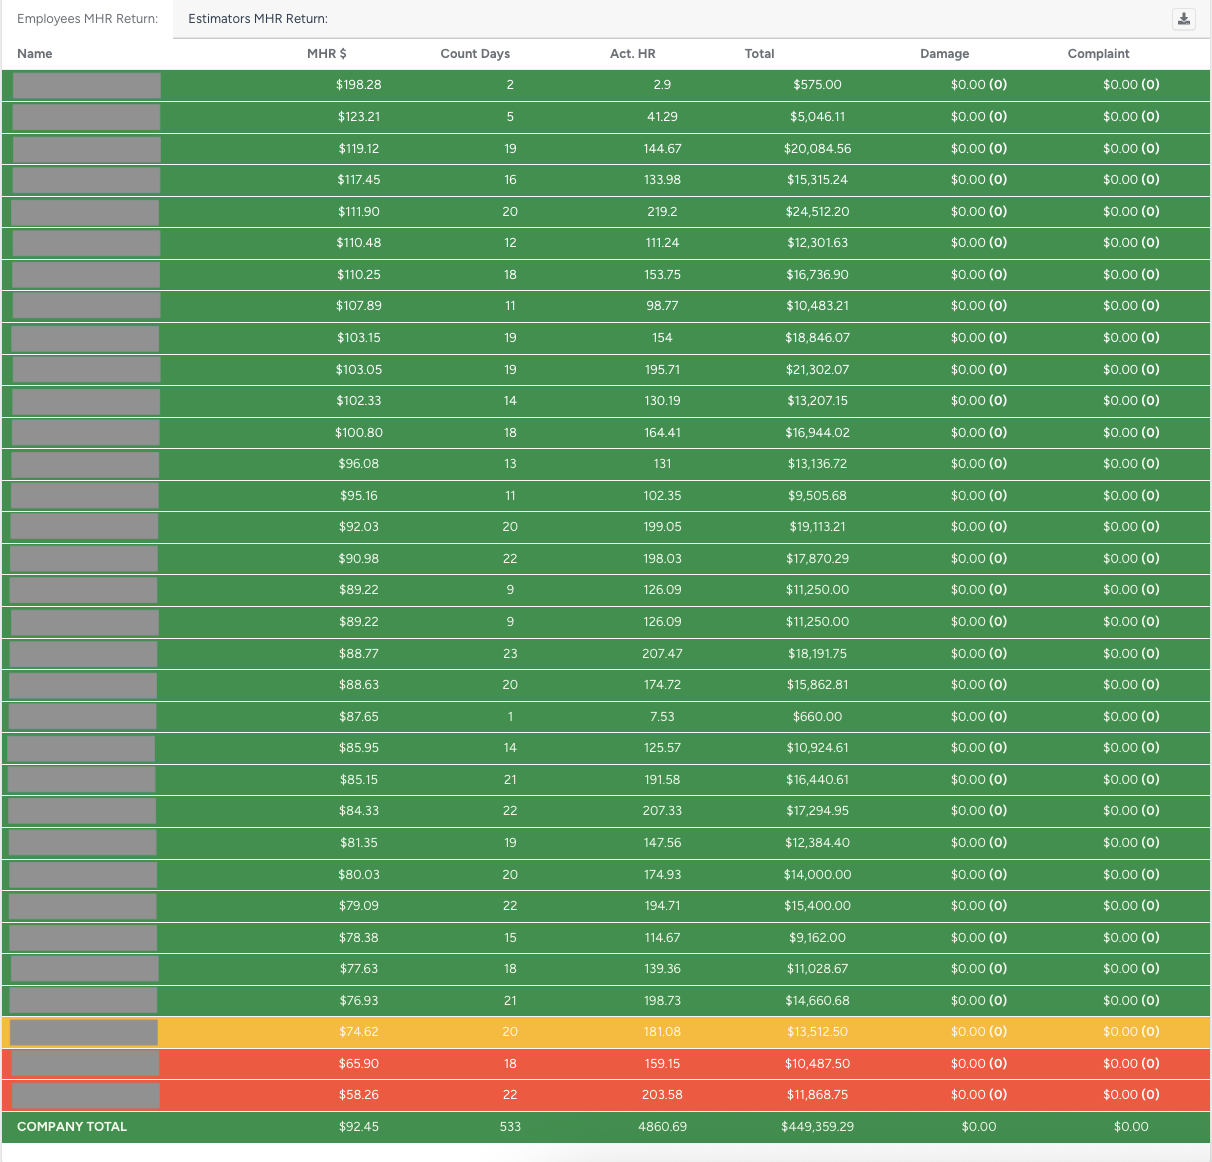
Report Columns
Name — name of the field worker
MHR ($) — man-hour return in selected currency
Count Days — number of working days included in the report
Act. HR — actual hour return
Total ($) — total value of completed work
Damage ($) — total amount of recorded damages
Complaint ($) — total value associated with complaints
The company total is displayed at the bottom of each column.
The same structure applies to the Estimators’ MHR Return table.
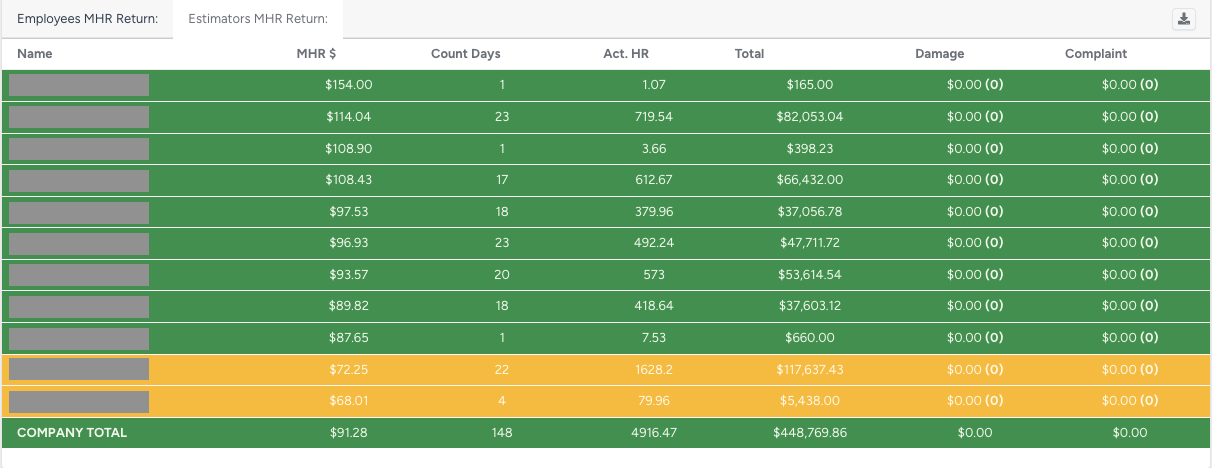
Color Coding
The statistics are color-coded according to the man-hour rate (MHR) in the bottom row:
- Bright green - the rate is above $100.
- Dark Green - the rate is between $75 and $100.
- Yellow - the rate is between $67 and $75.
- Red - the rate is below $67.
- Gray - the calculation is not possible/the job is not finished.
The MHR Return report provides a clear and structured view of productivity and financial results for both employees and estimators. Color coding supports quick evaluation of performance levels, enabling timely management decisions.
Estimator Task Assigned :
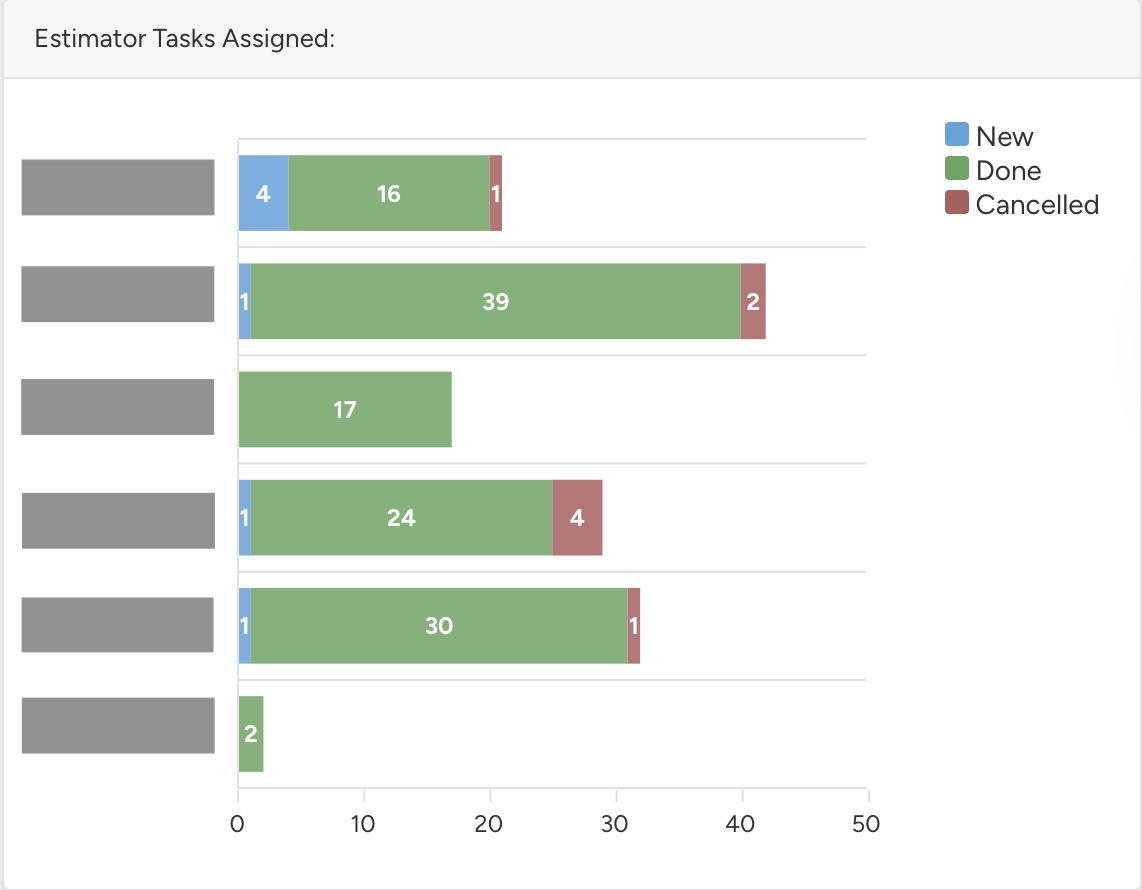
The bar chart displays the number of estimates per estimator by status: New, Done, and Cancelled.
Estimators Leads:
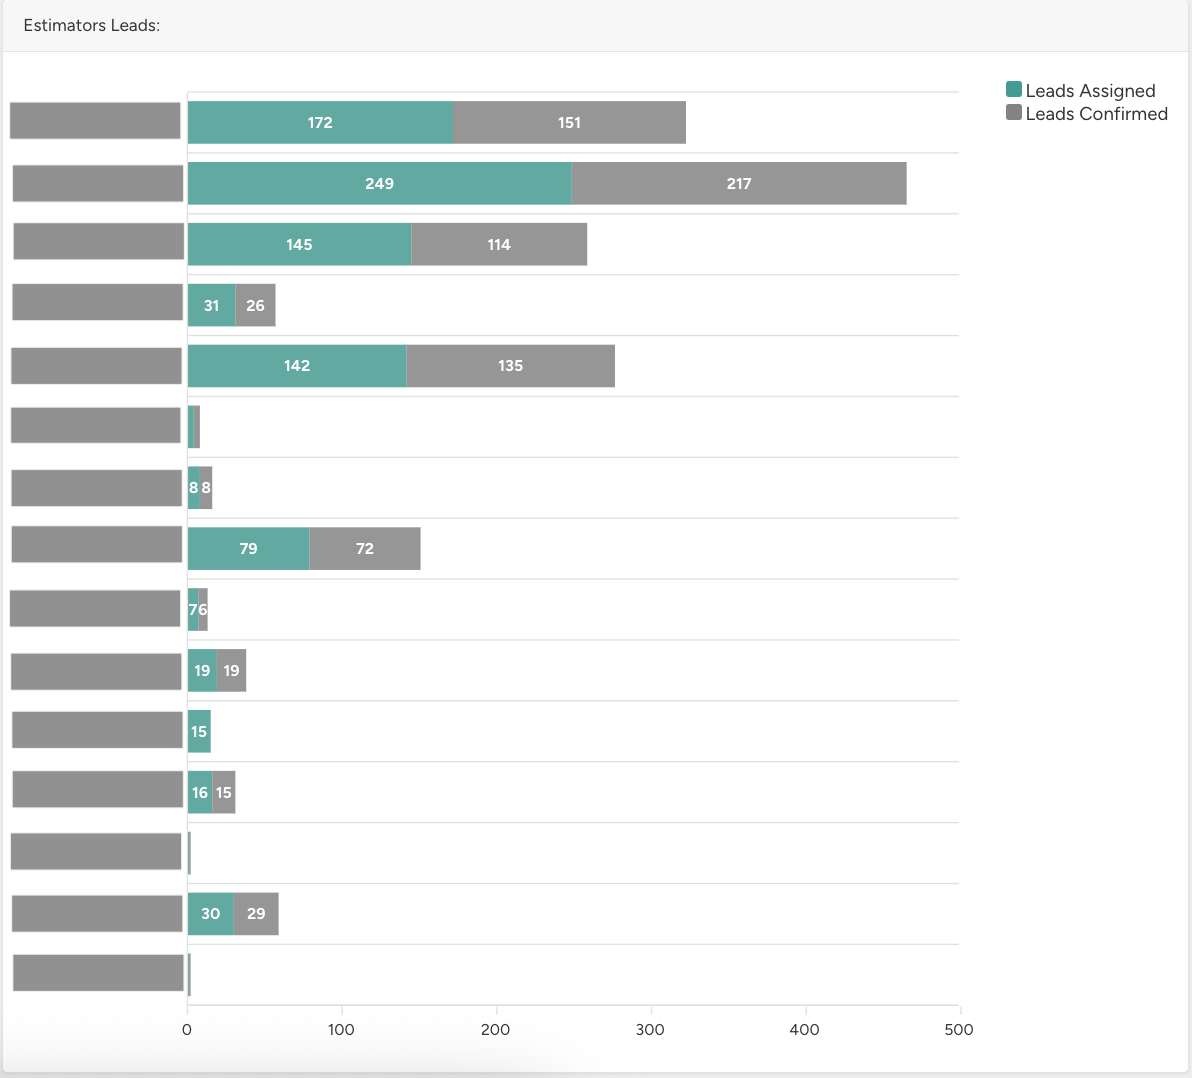
The bar chart displays the number of assigned leads and confirmed leads per estimator.
The Estimator Statistics module delivers a structured and detailed overview of estimator activity, performance, and financial outcomes. With dashboards, charts, and color-coded metrics, it enables effective monitoring, informed decision-making, and continuous performance optimization across employees and estimators.