
The Sales Statistics module provides detailed insights into estimates, work orders, and invoice sales.
This section is designed to help you understand how each type of entity performs, and to analyze sales across different stages of the project journey.
To access the Sales Statistics section, go to Business Intelligence → Sales.
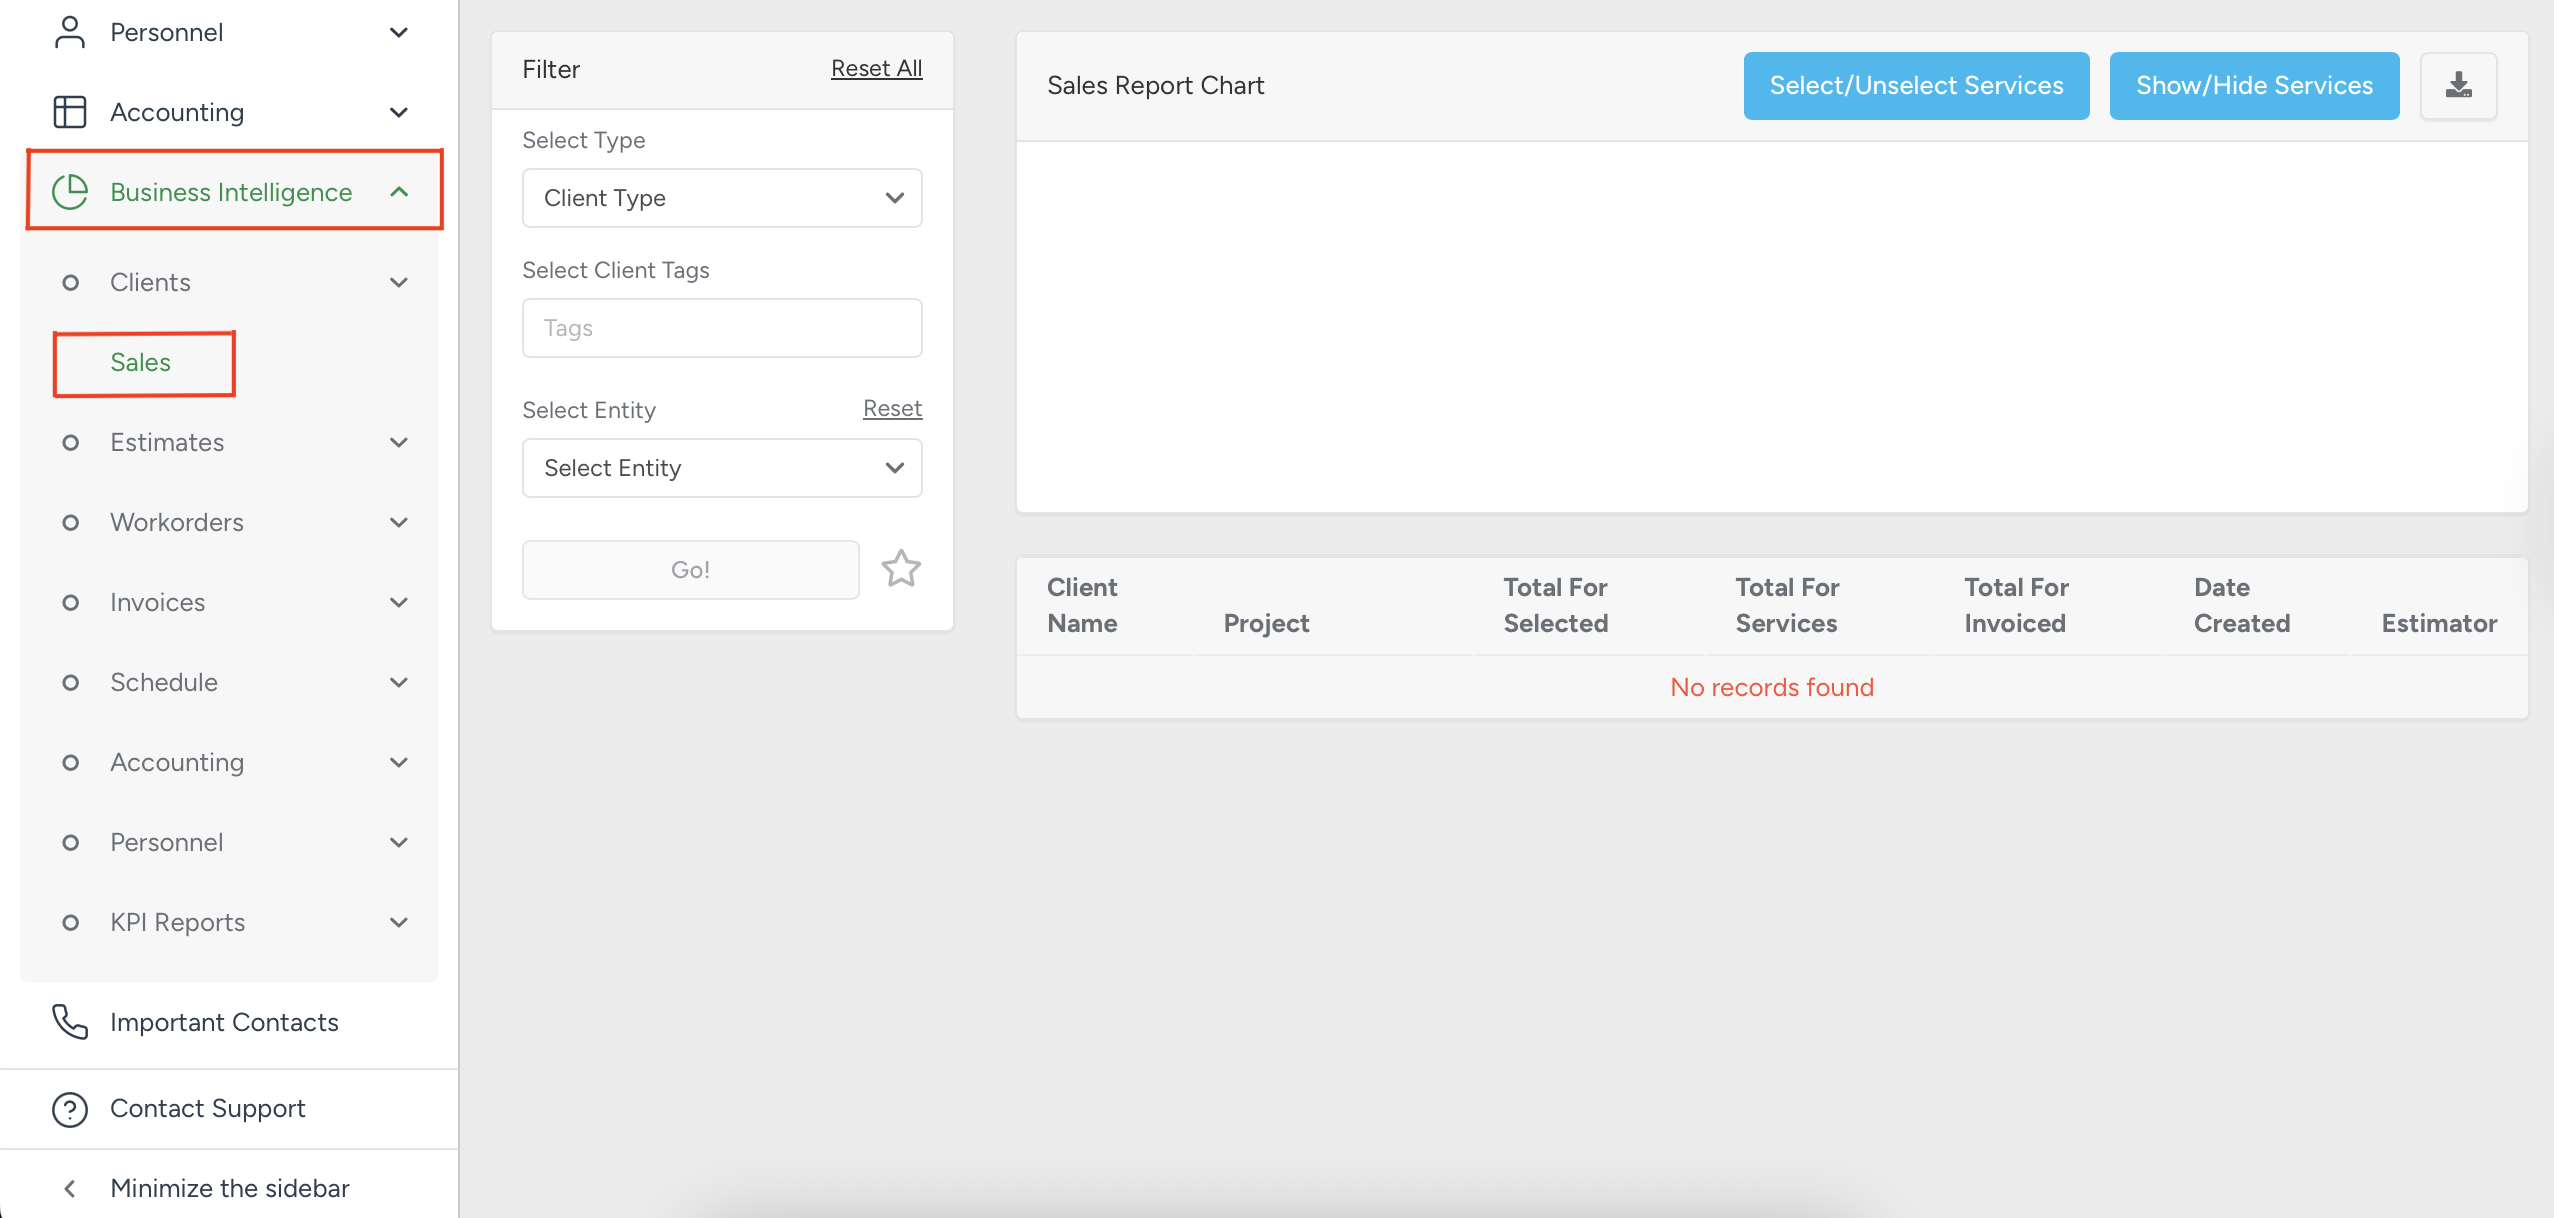
On the left side of the screen, you’ll find a filter panel that can be adjusted to match your needs and preferences.
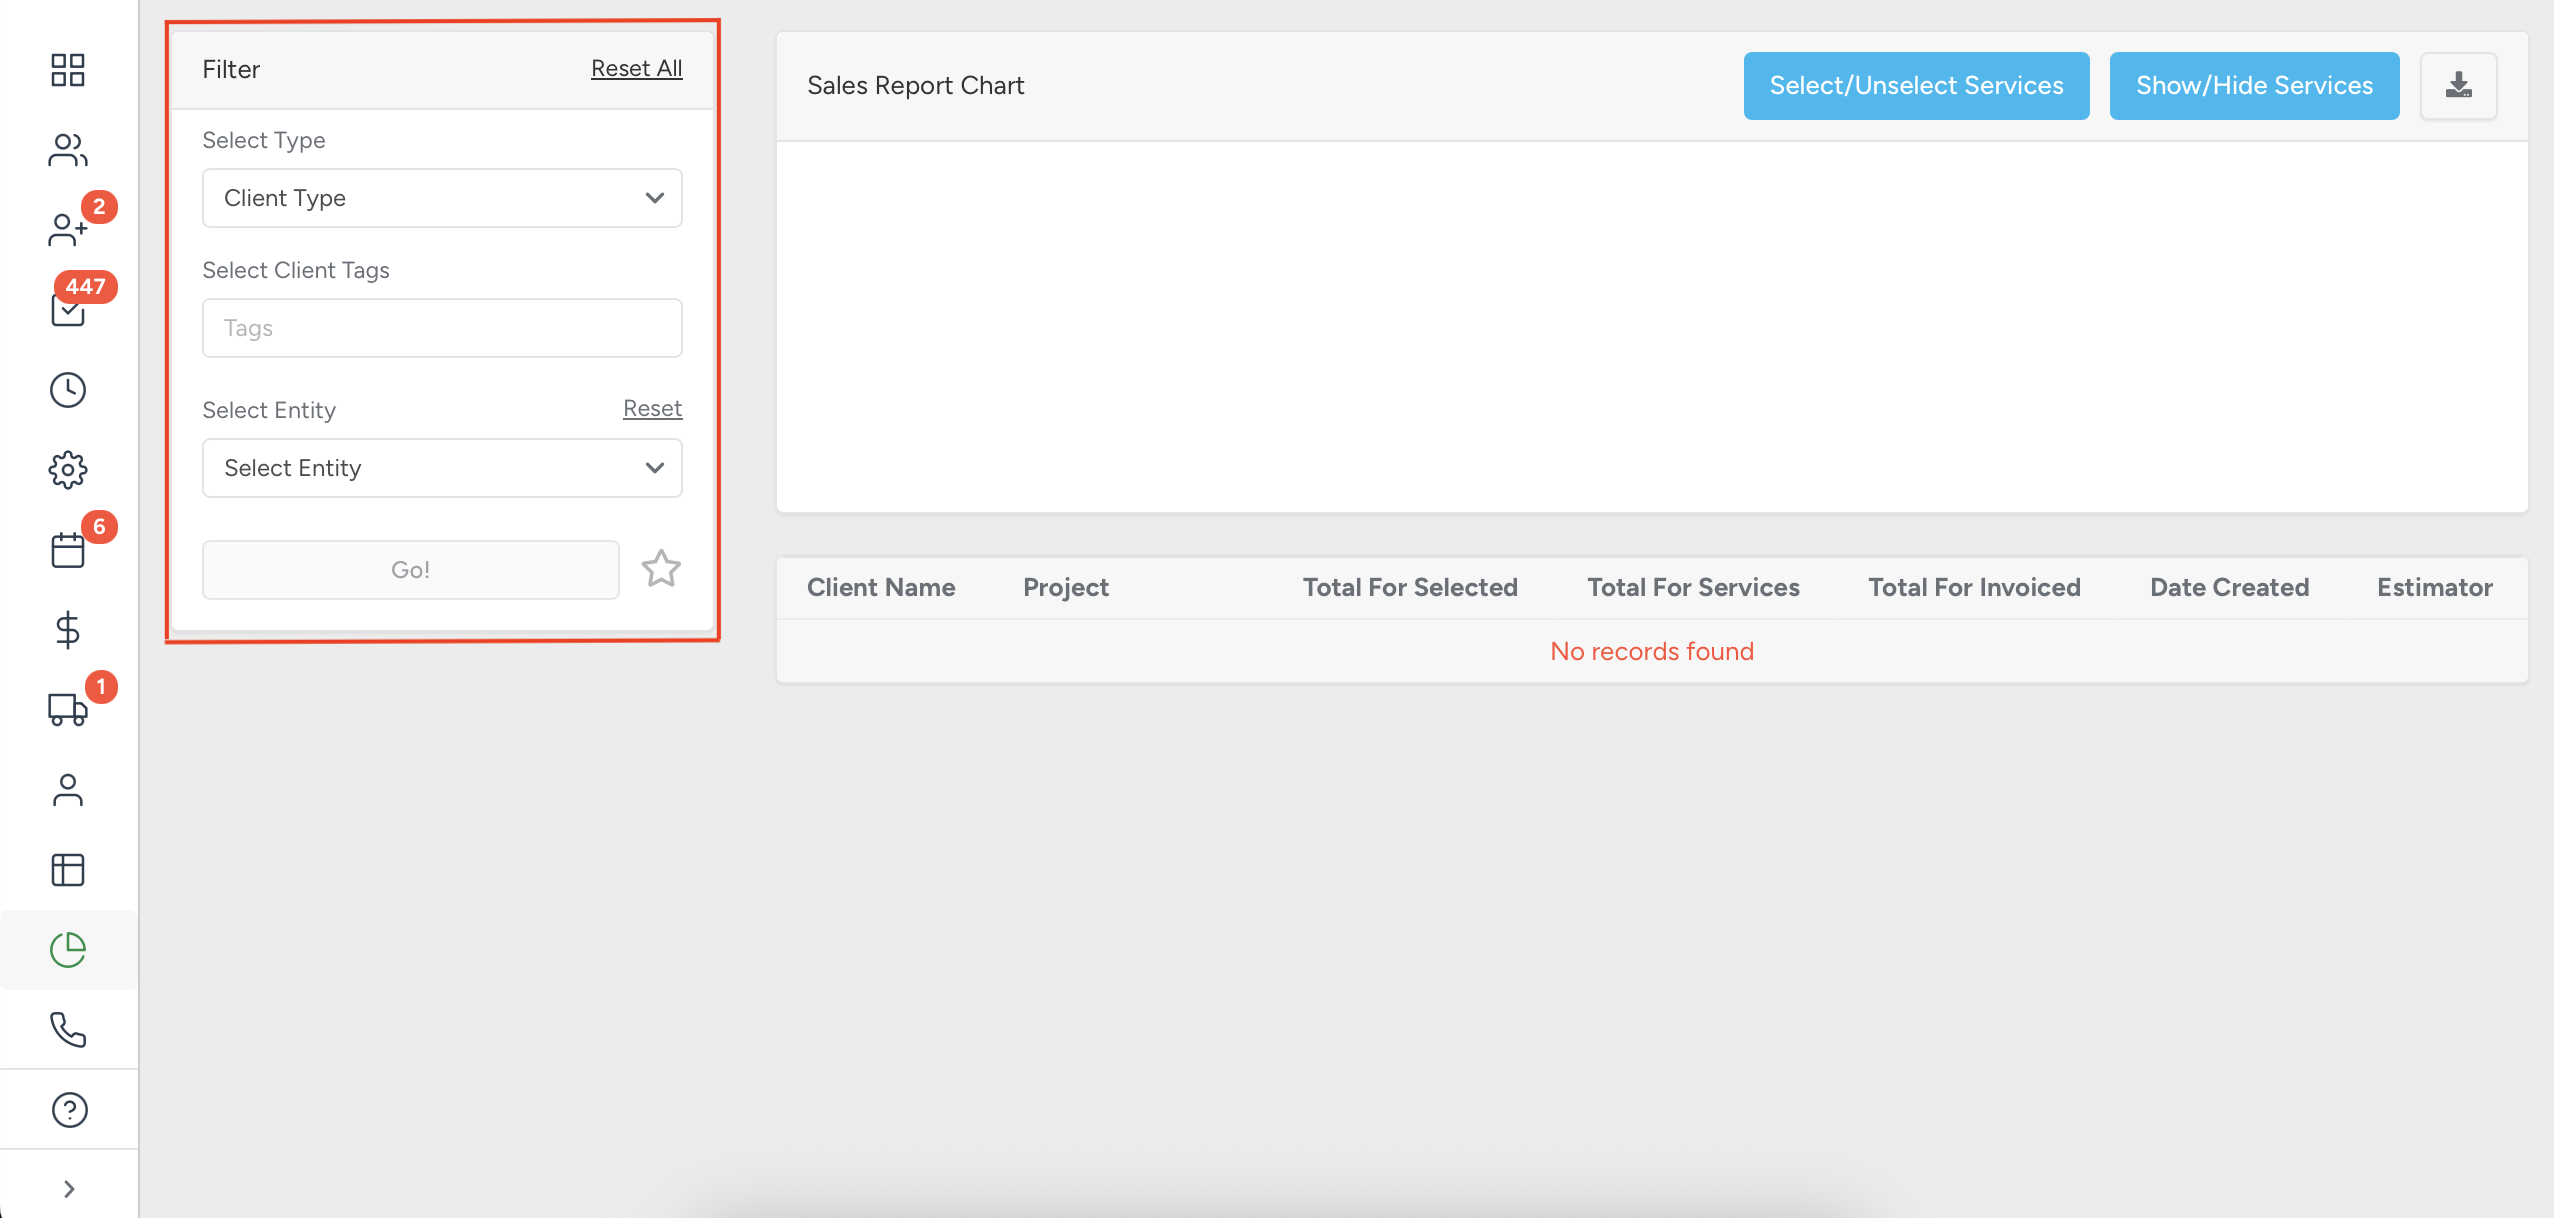
- To filter sales statistics by client type, open the Client Type field and select the desired option from the drop-down menu. If no client type is selected, the system will include all client types. Available options are Residential, Commercial, or Municipal.
- You can also refine results by adding tags in the Select Client Tags field for more precise filtering.
- To filter sales statistics by entity type, open the Select Entity field and choose whether to view data for Estimates, Workorders, or Invoices. If no entity type is selected, the system will include all entities.
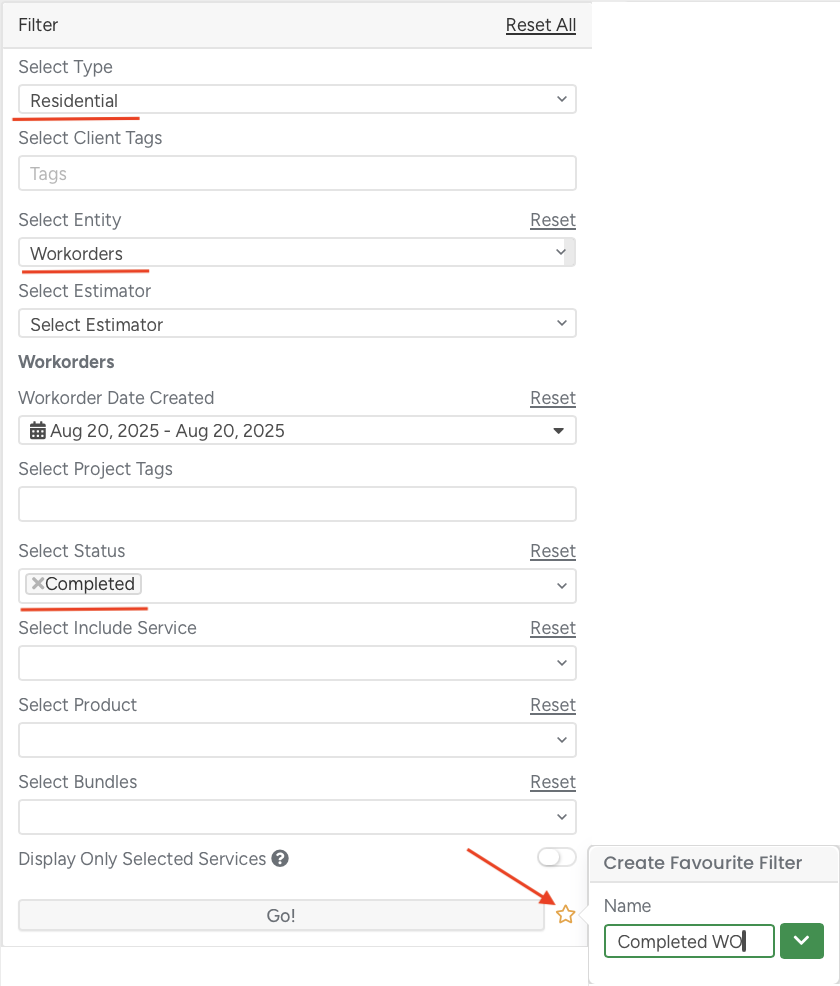
After you choose an Entity, additional filter options become available.
You can refine results by applying filters:
Estimator
Date Created (Estimate / Work Order / Invoice)
Project Tags
Estimate Status
Include Service, Products, Bundles
Invoice Paid Date (for Invoices only)
To reset the filter, or return a specific field to its default state, click Reset.
Once all required filters are set, click Go! to generate the report.
You can also create and save custom filters, so you don’t need to select options each time you generate a report manually.
After filling out the filter criteria, click the Star icon next to Go!. A pop-up window will appear where you can name the filter and then click the down arrow.
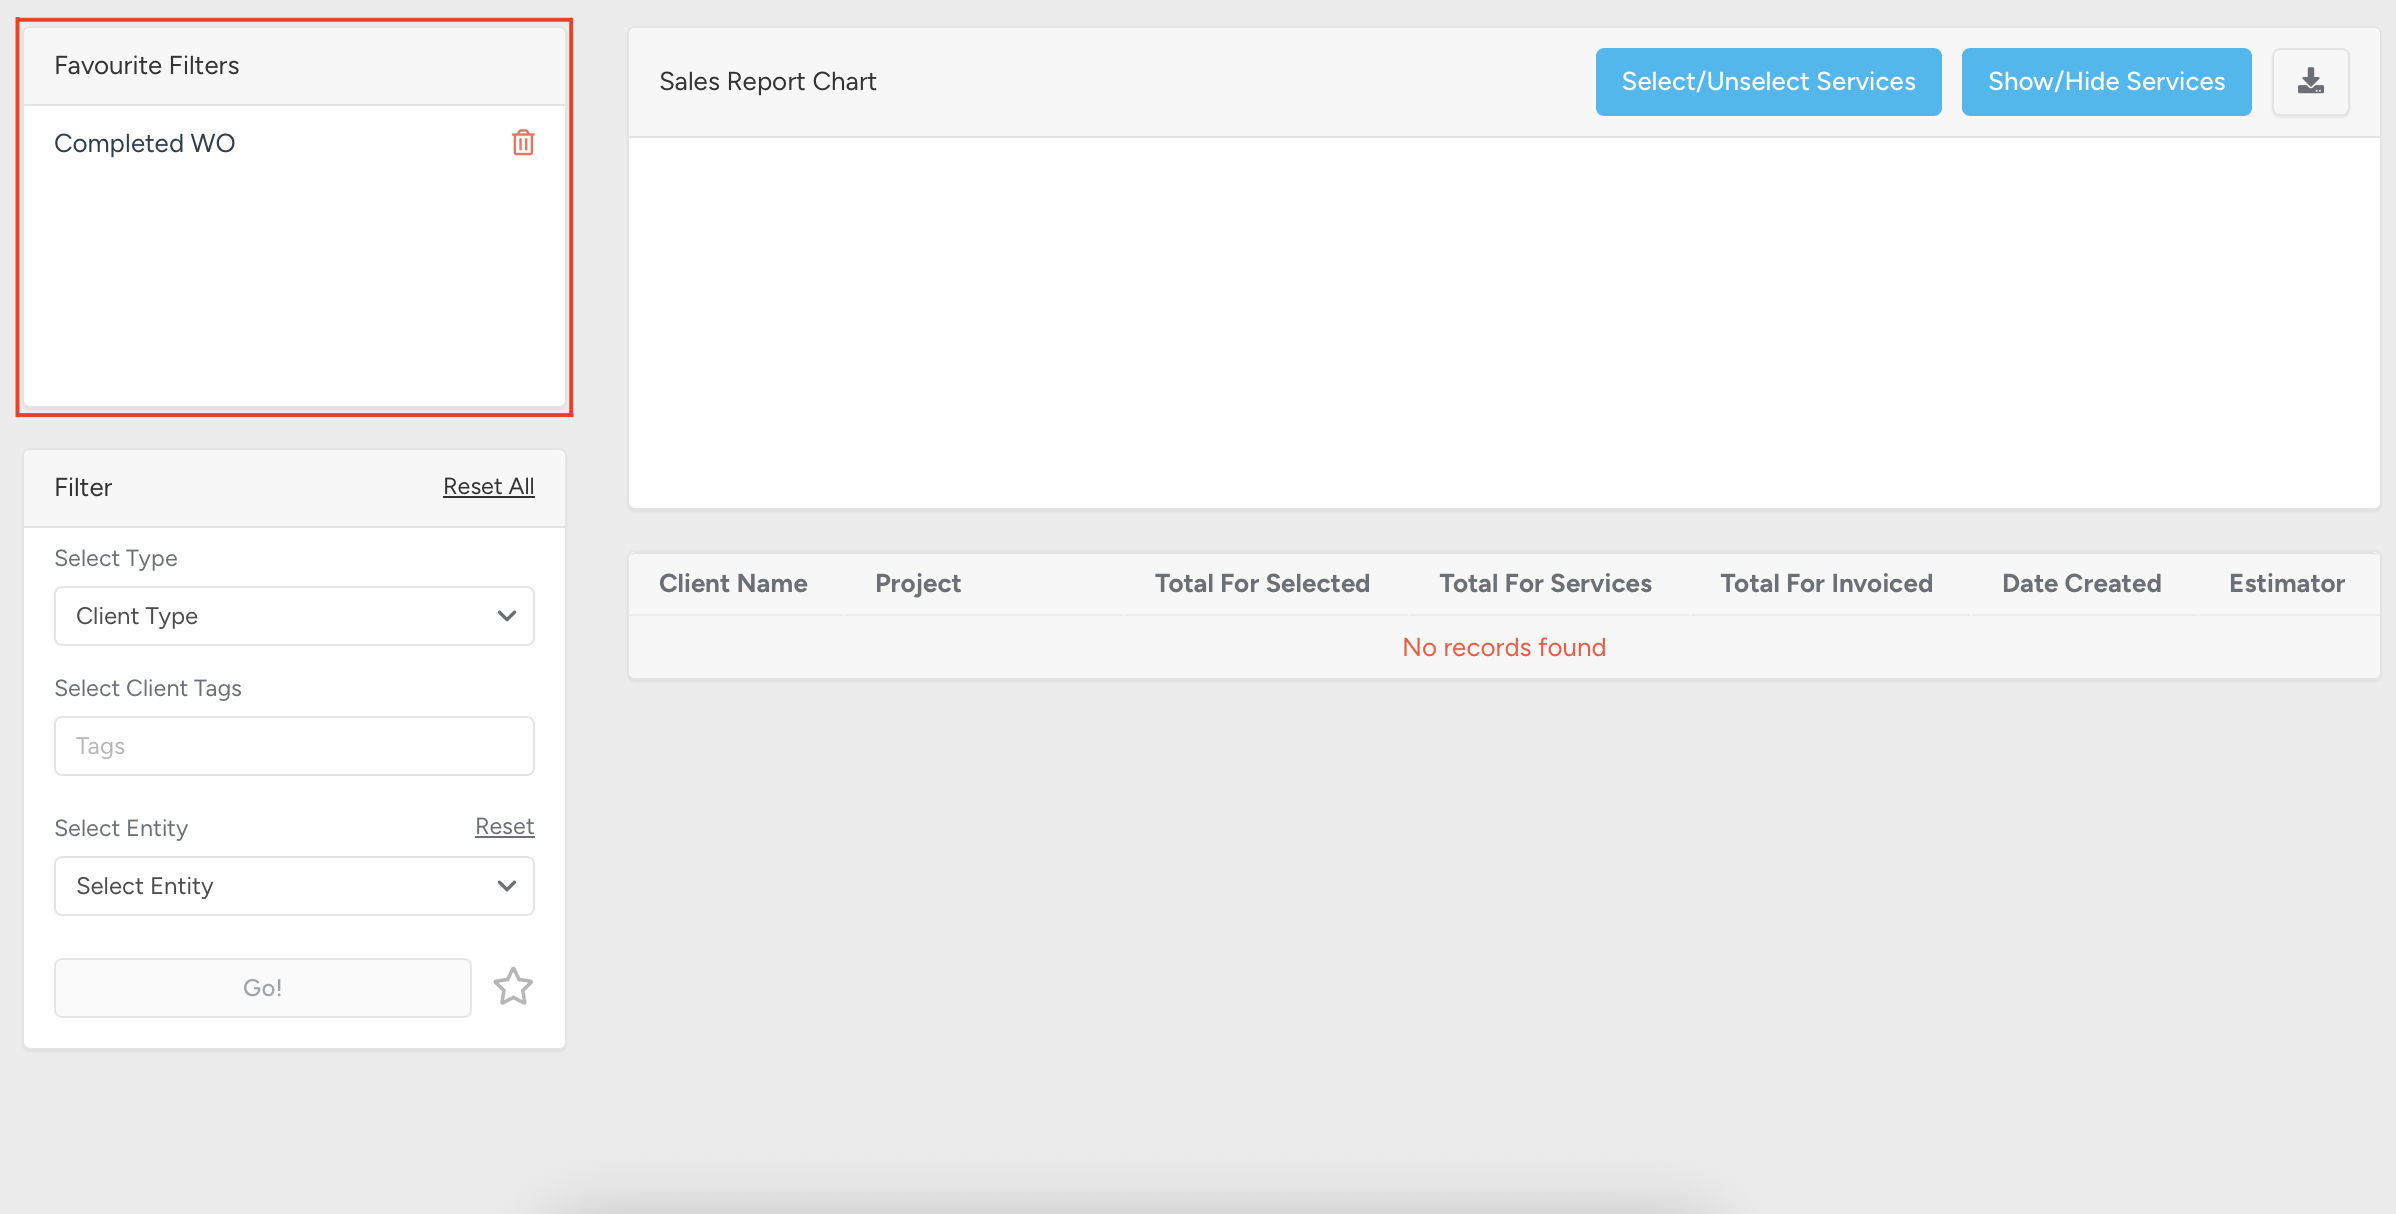
After you save a favorite filter, it will appear above the main filter as a separate unit. You can reuse it at any time without having to set all the criteria again — simply select the appropriate time period to view relevant data.
To delete a saved filter, click the Bin icon.
After you apply the desired filters (for example, Work Orders with the status Completed for Residential clients), the Sales Report will be displayed with the chart in the upper-right section and a table with client and project details below.
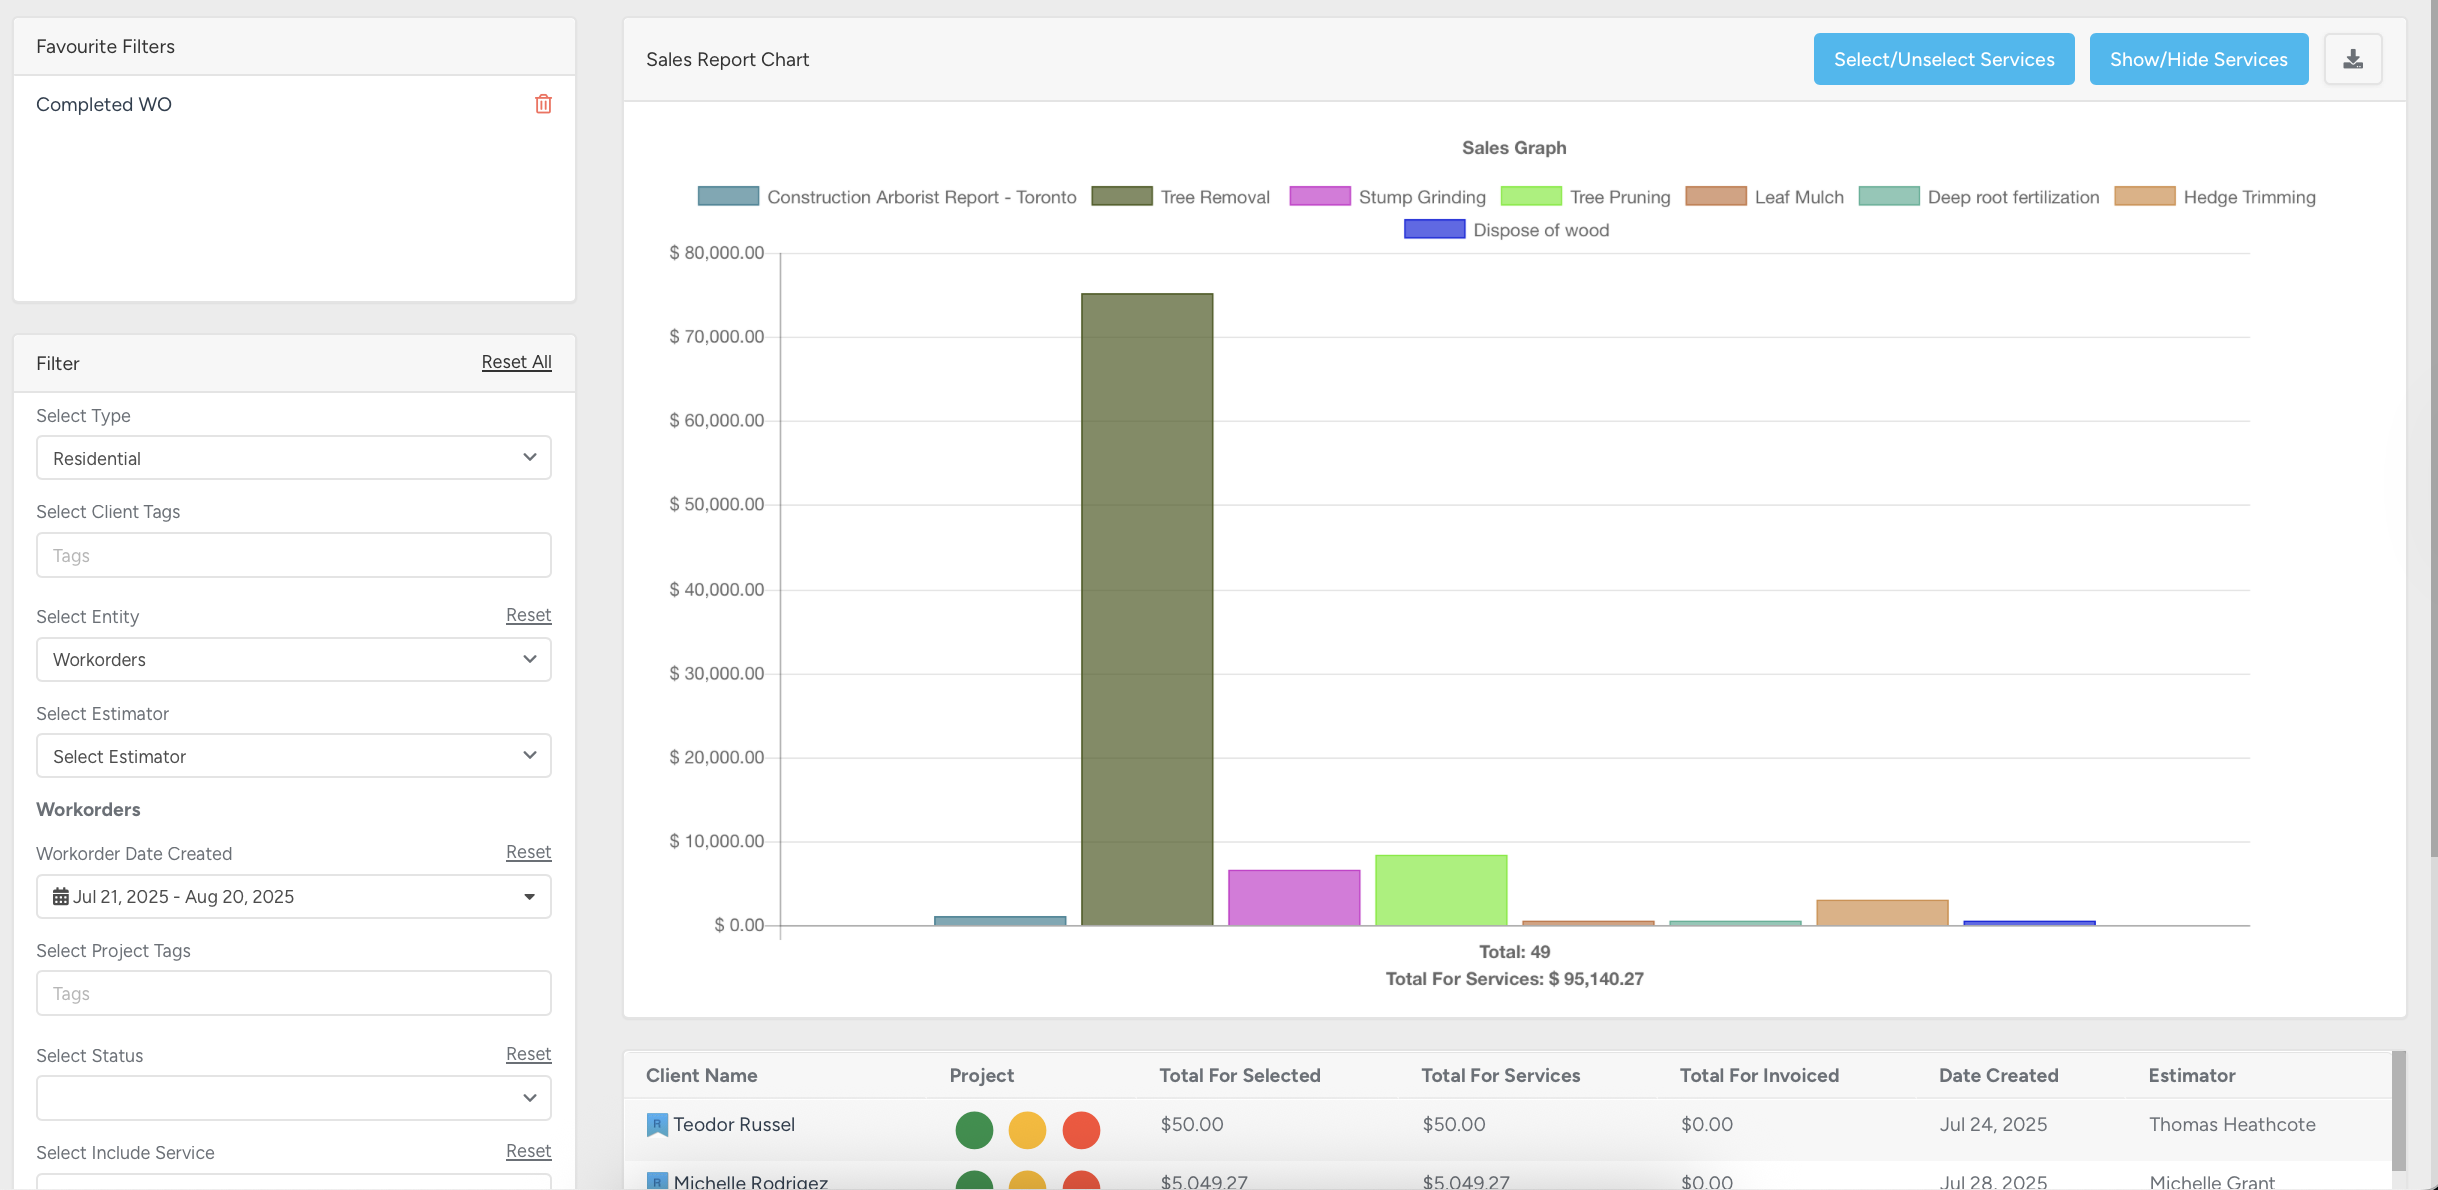
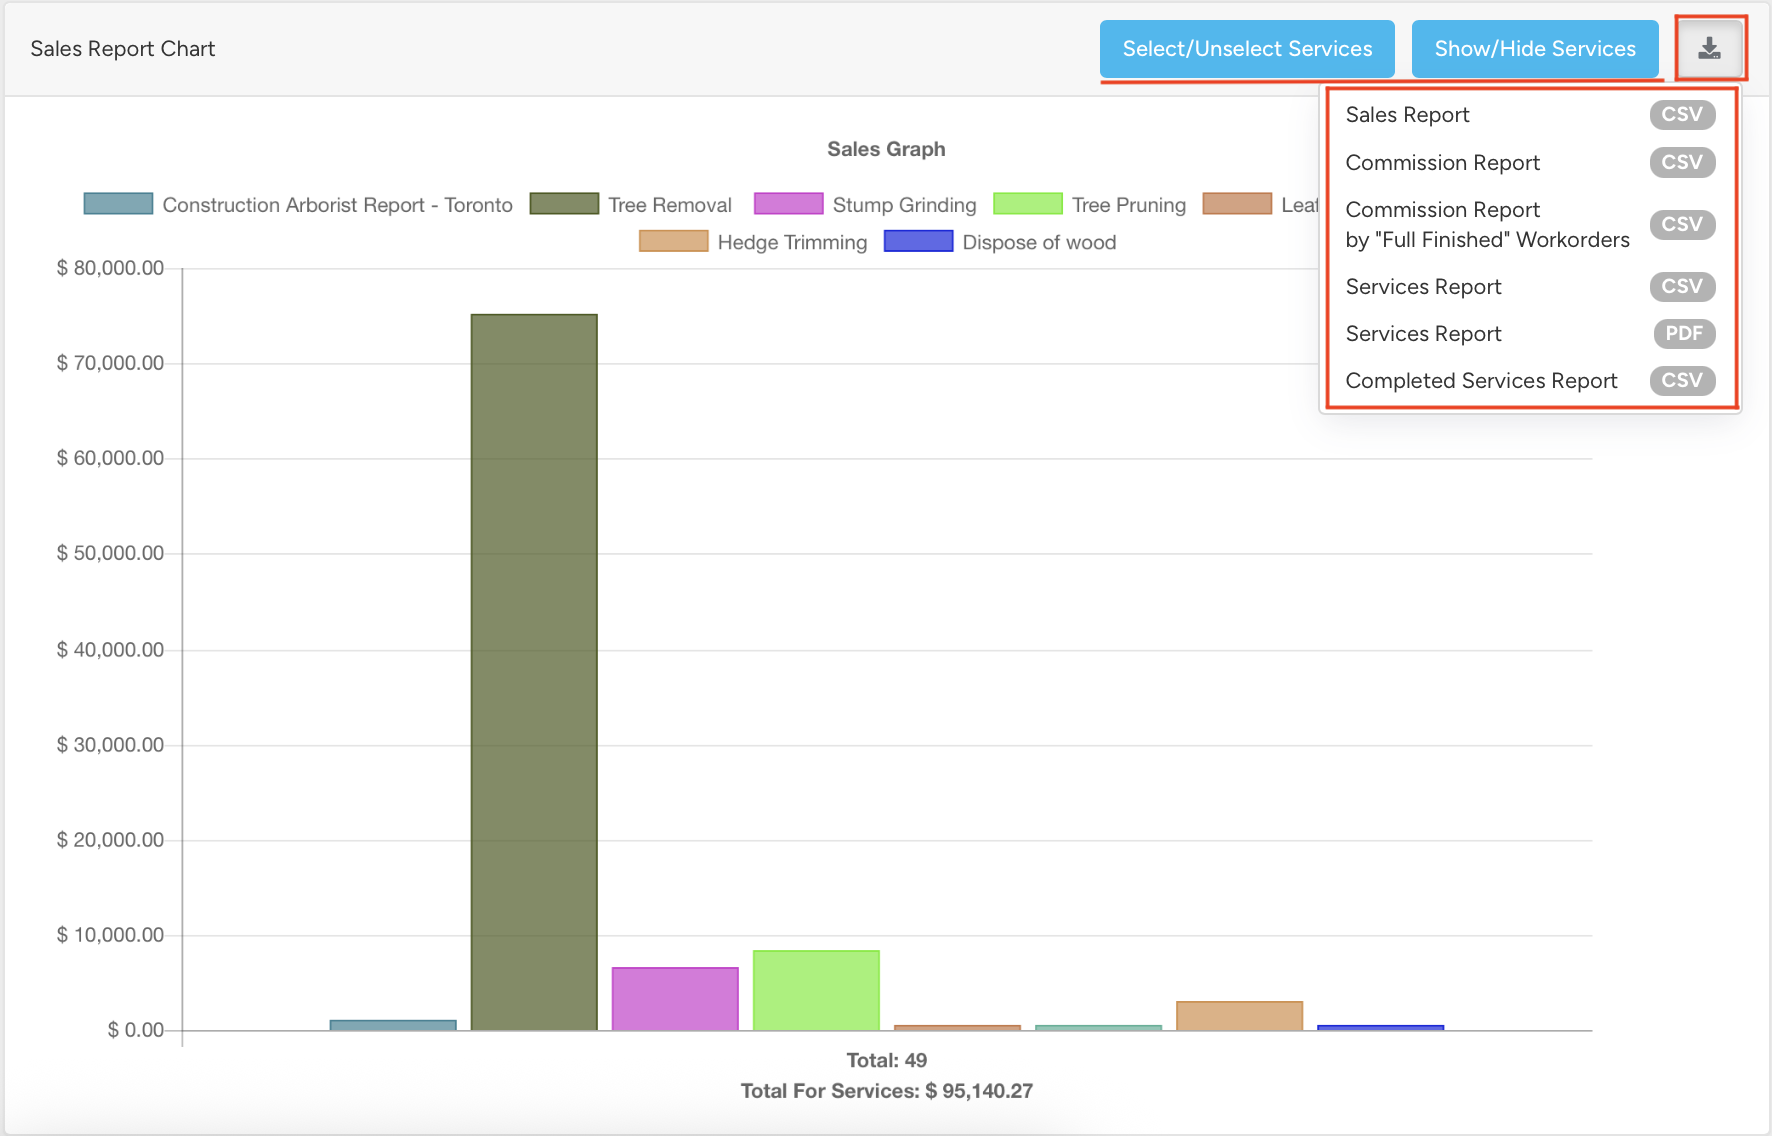
Let’s take a closer look at the Sales Report chart:
Use Select/Unselect Services to remove all services from the chart at once.
Use Show/Hide Services to toggle the display of service names at the top of the chart.
Click the arrow button to view the list of available report download options.
Click on one or more service names to individually select or unselect them, adding or removing them from the chart as needed.
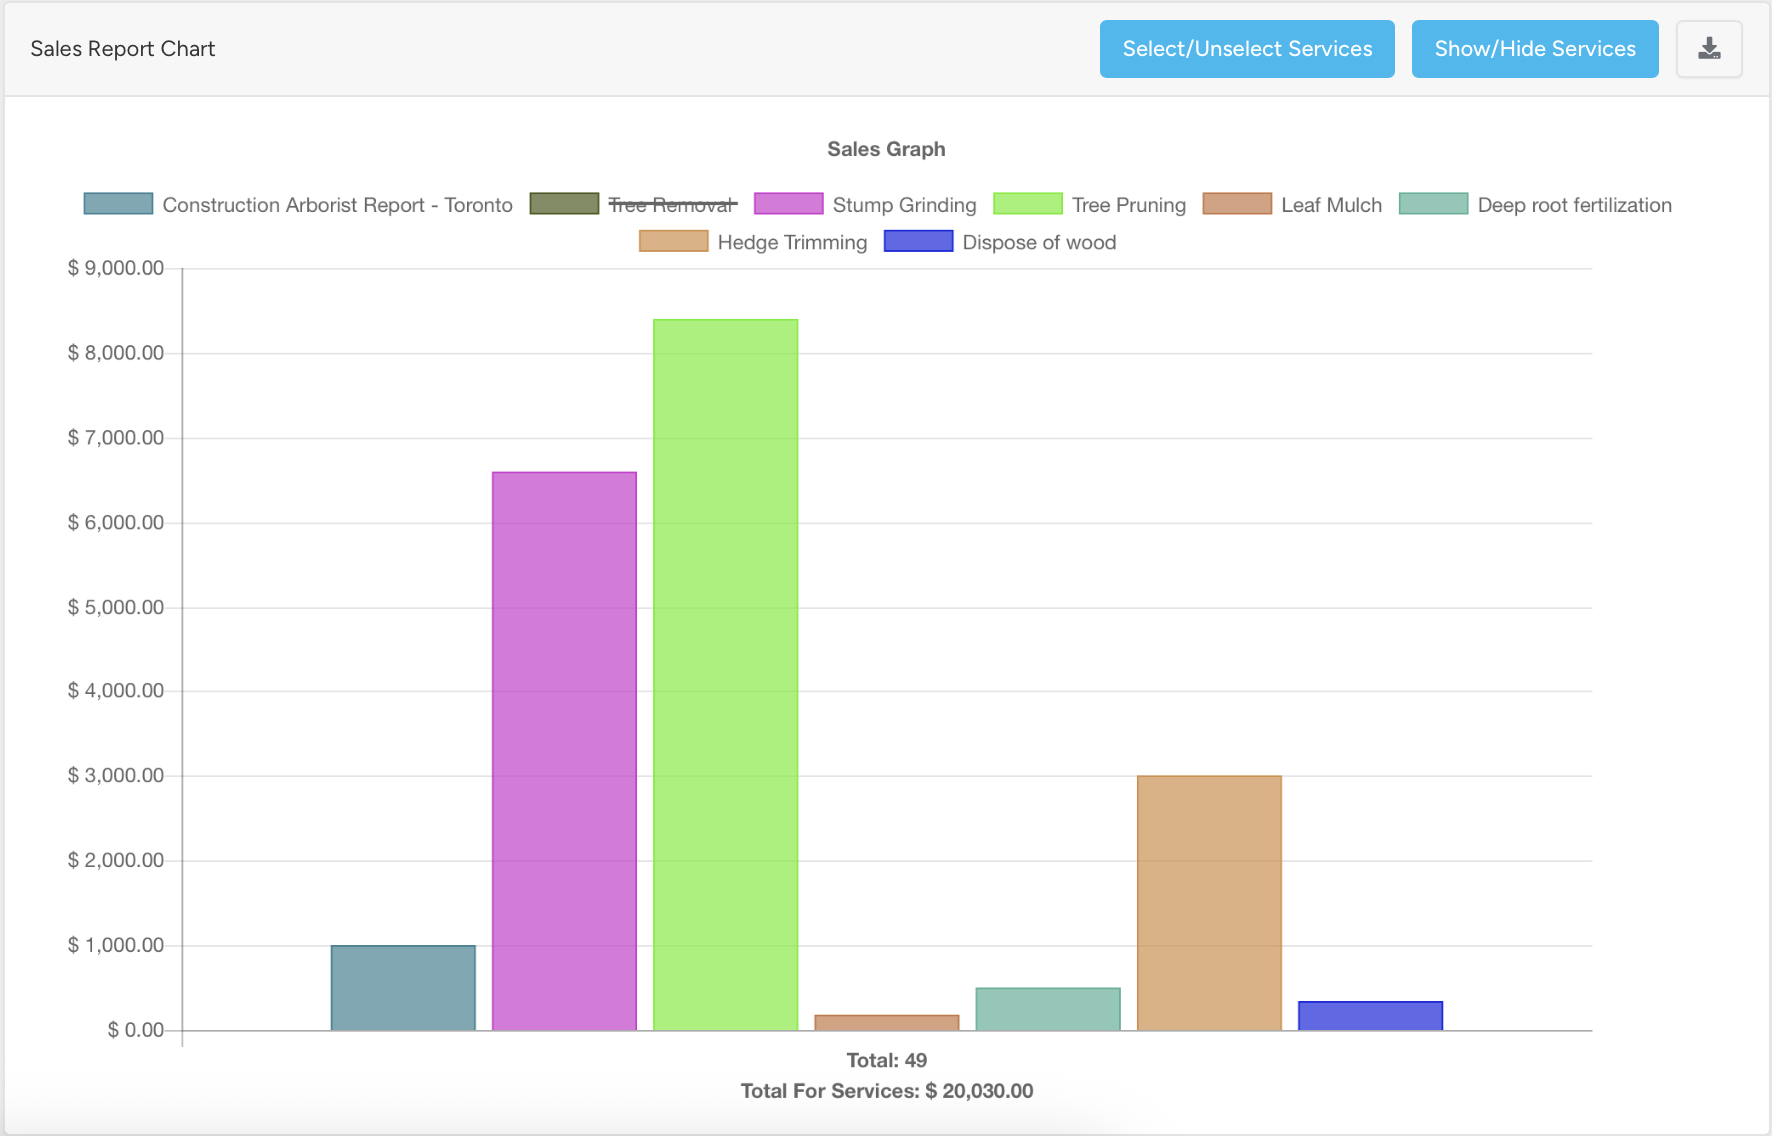
The vertical axis represents price, while the horizontal axis shows the total number of items and the total value of services in the selected currency.
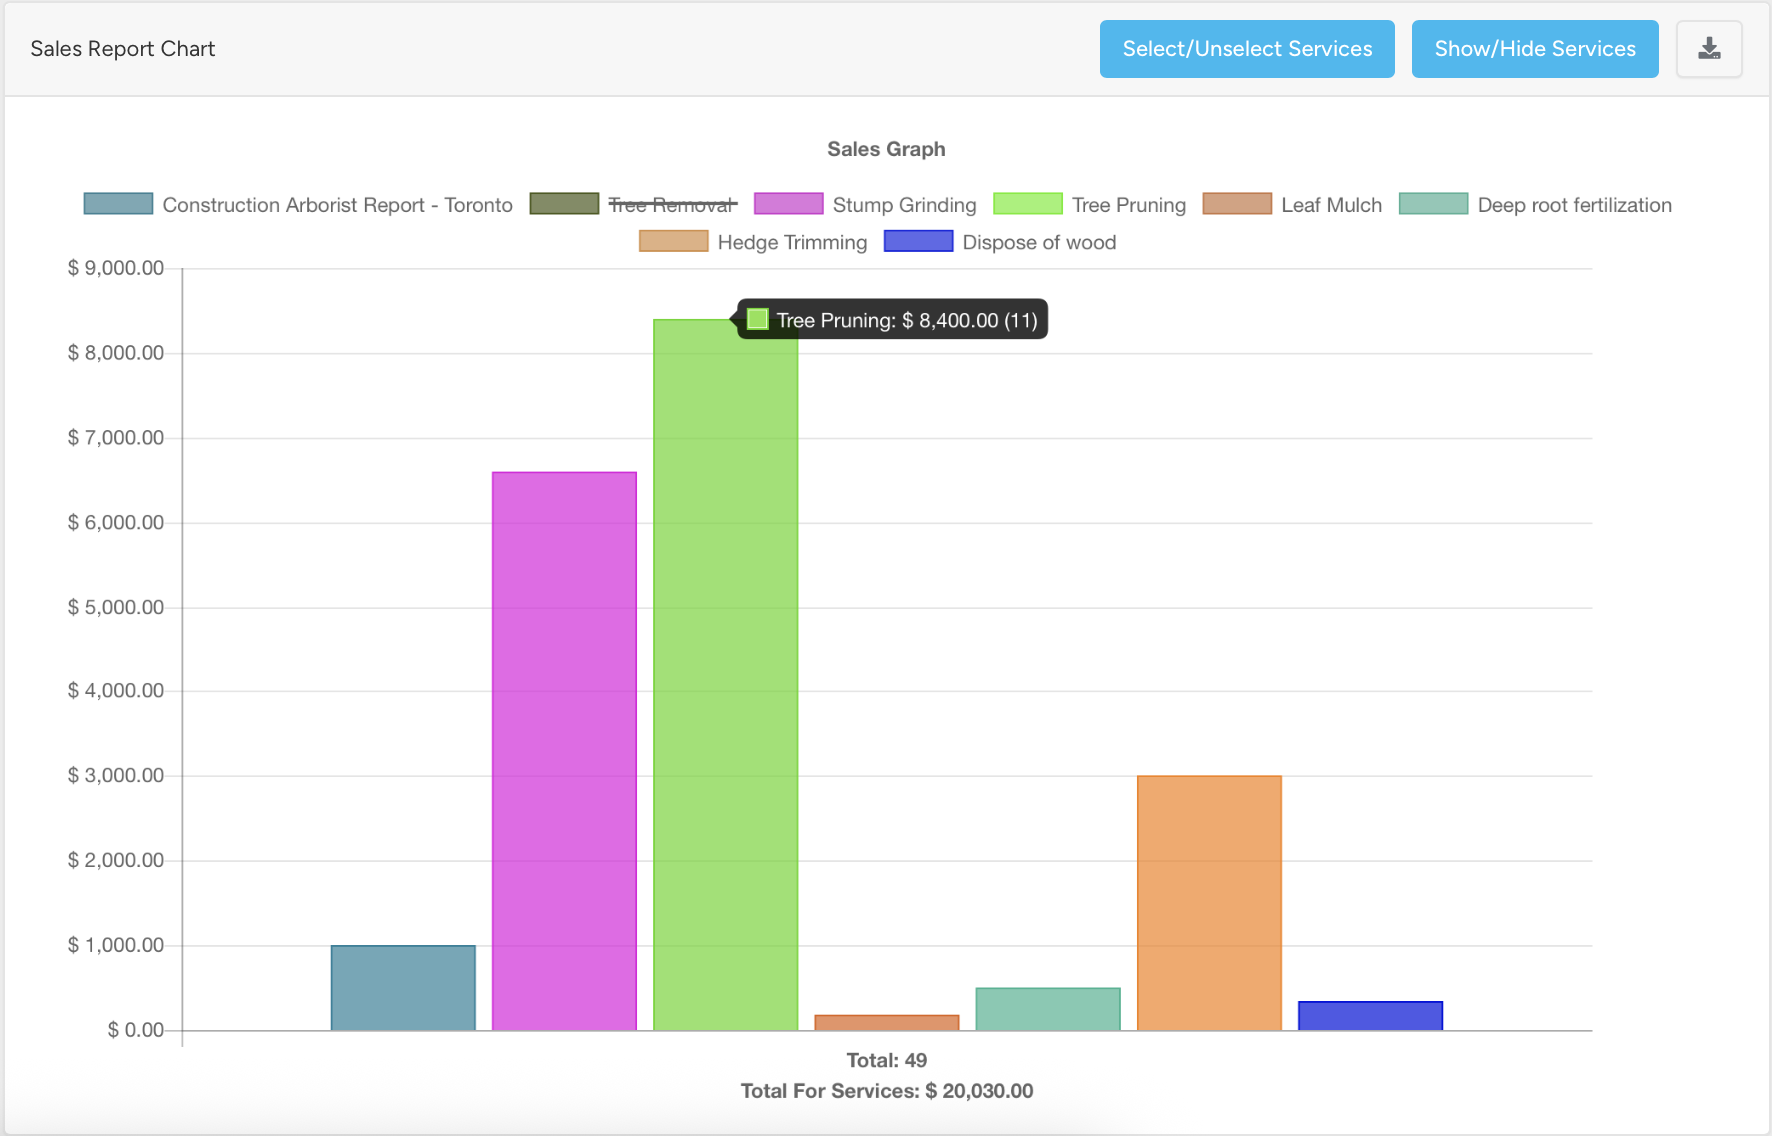
Hovering over a service on the chart will display detailed information for the selected filter, including the paid amount and the quantity of services.
An important control in the filter is the “Display Only Selected Services” button. For example, you select Deep Root Fertilization in the filter.
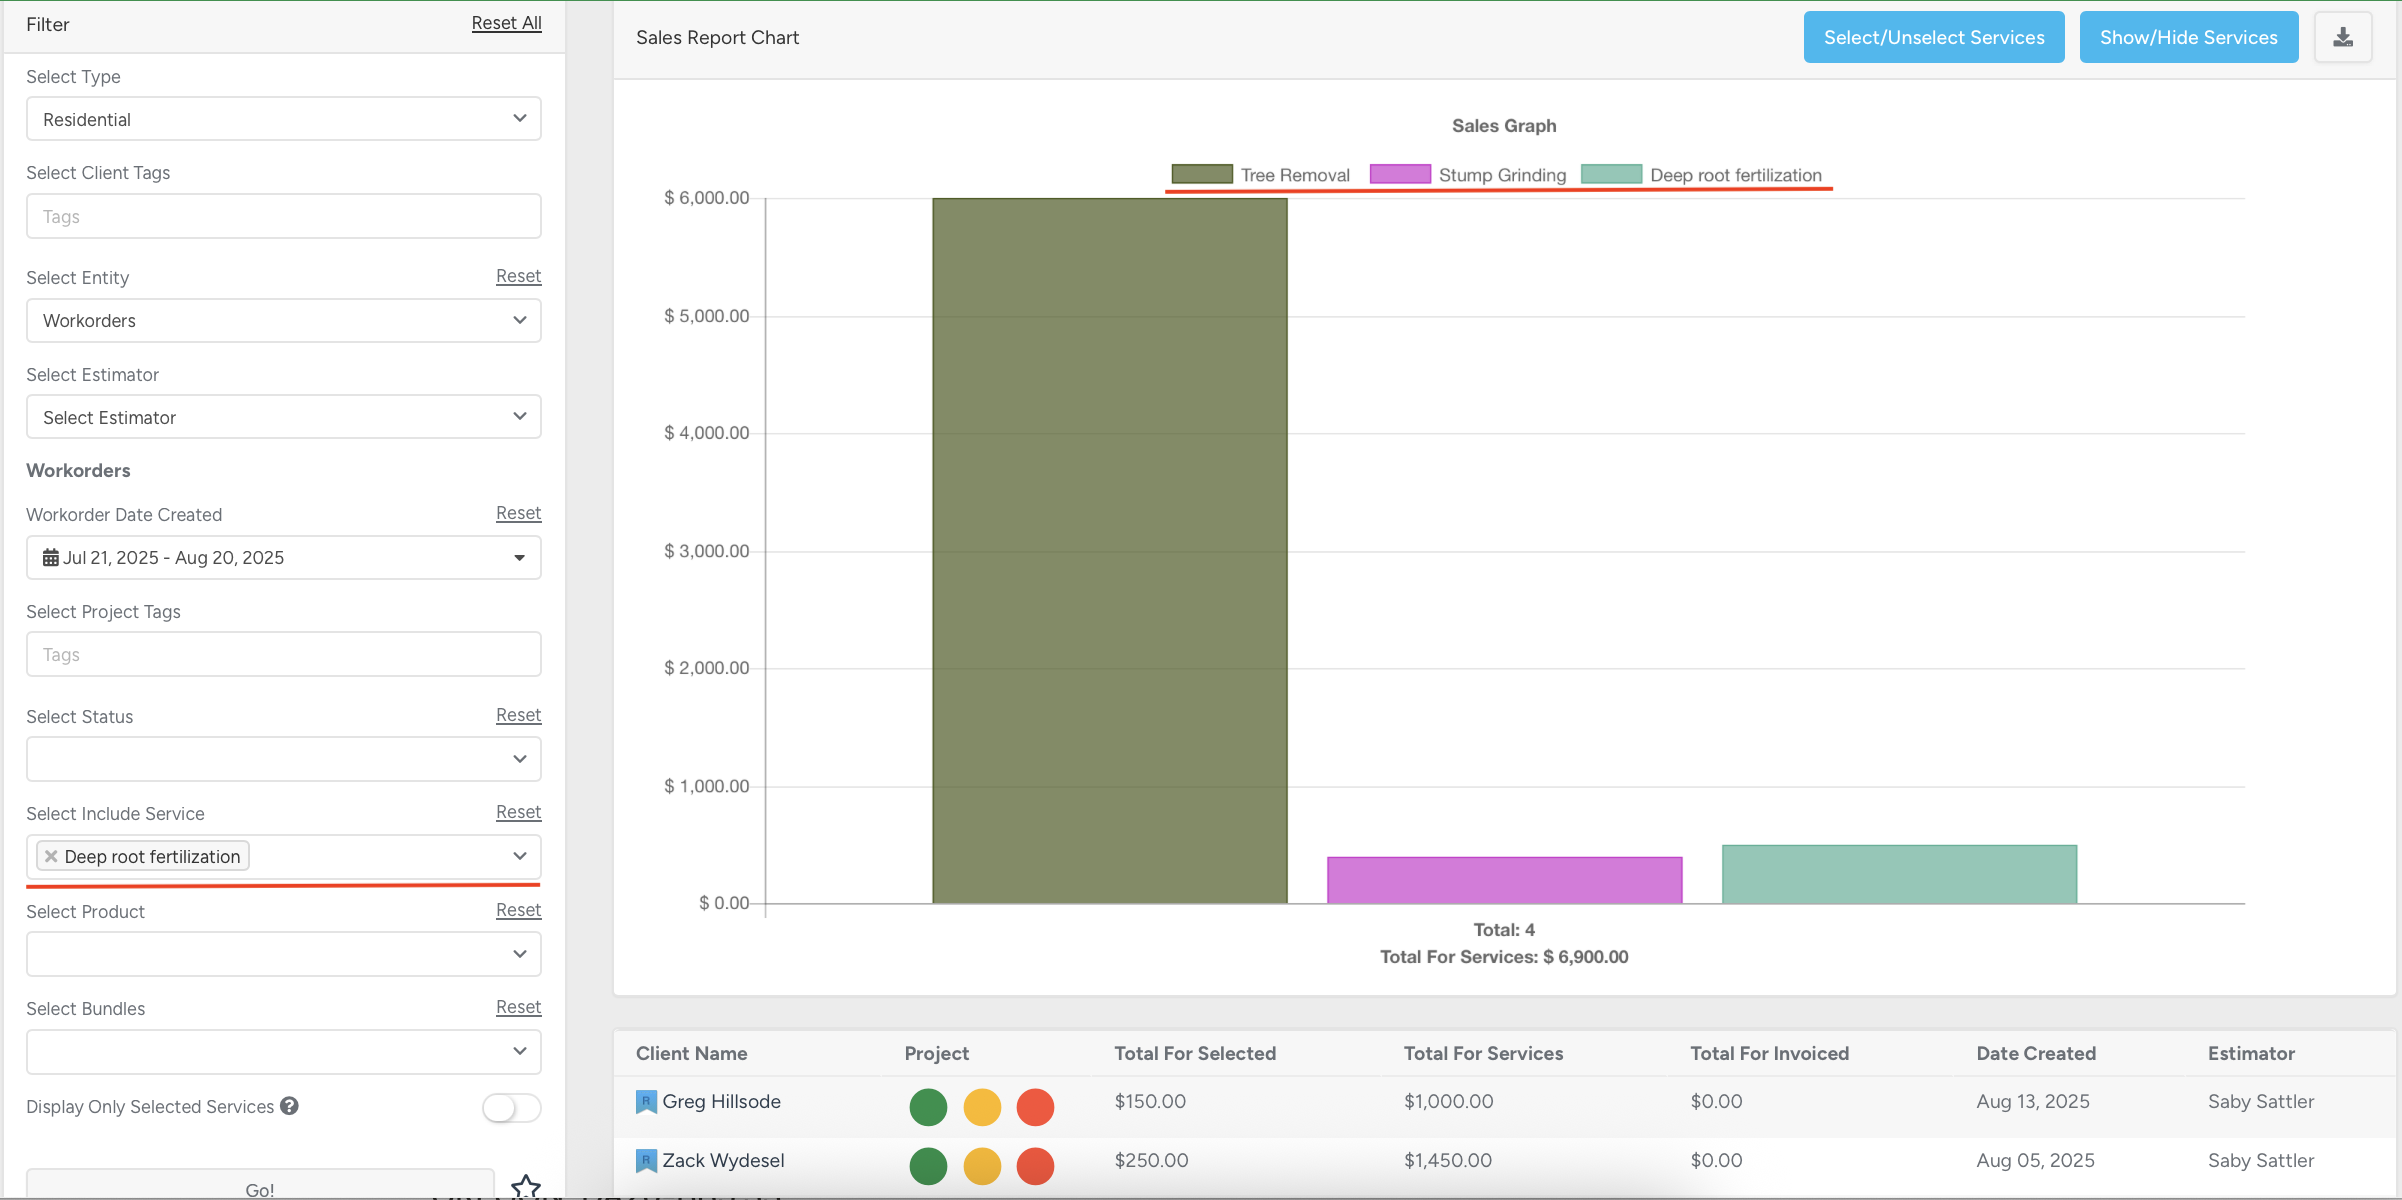
Even though it is selected, the report still shows this service together with other services from the same invoice.
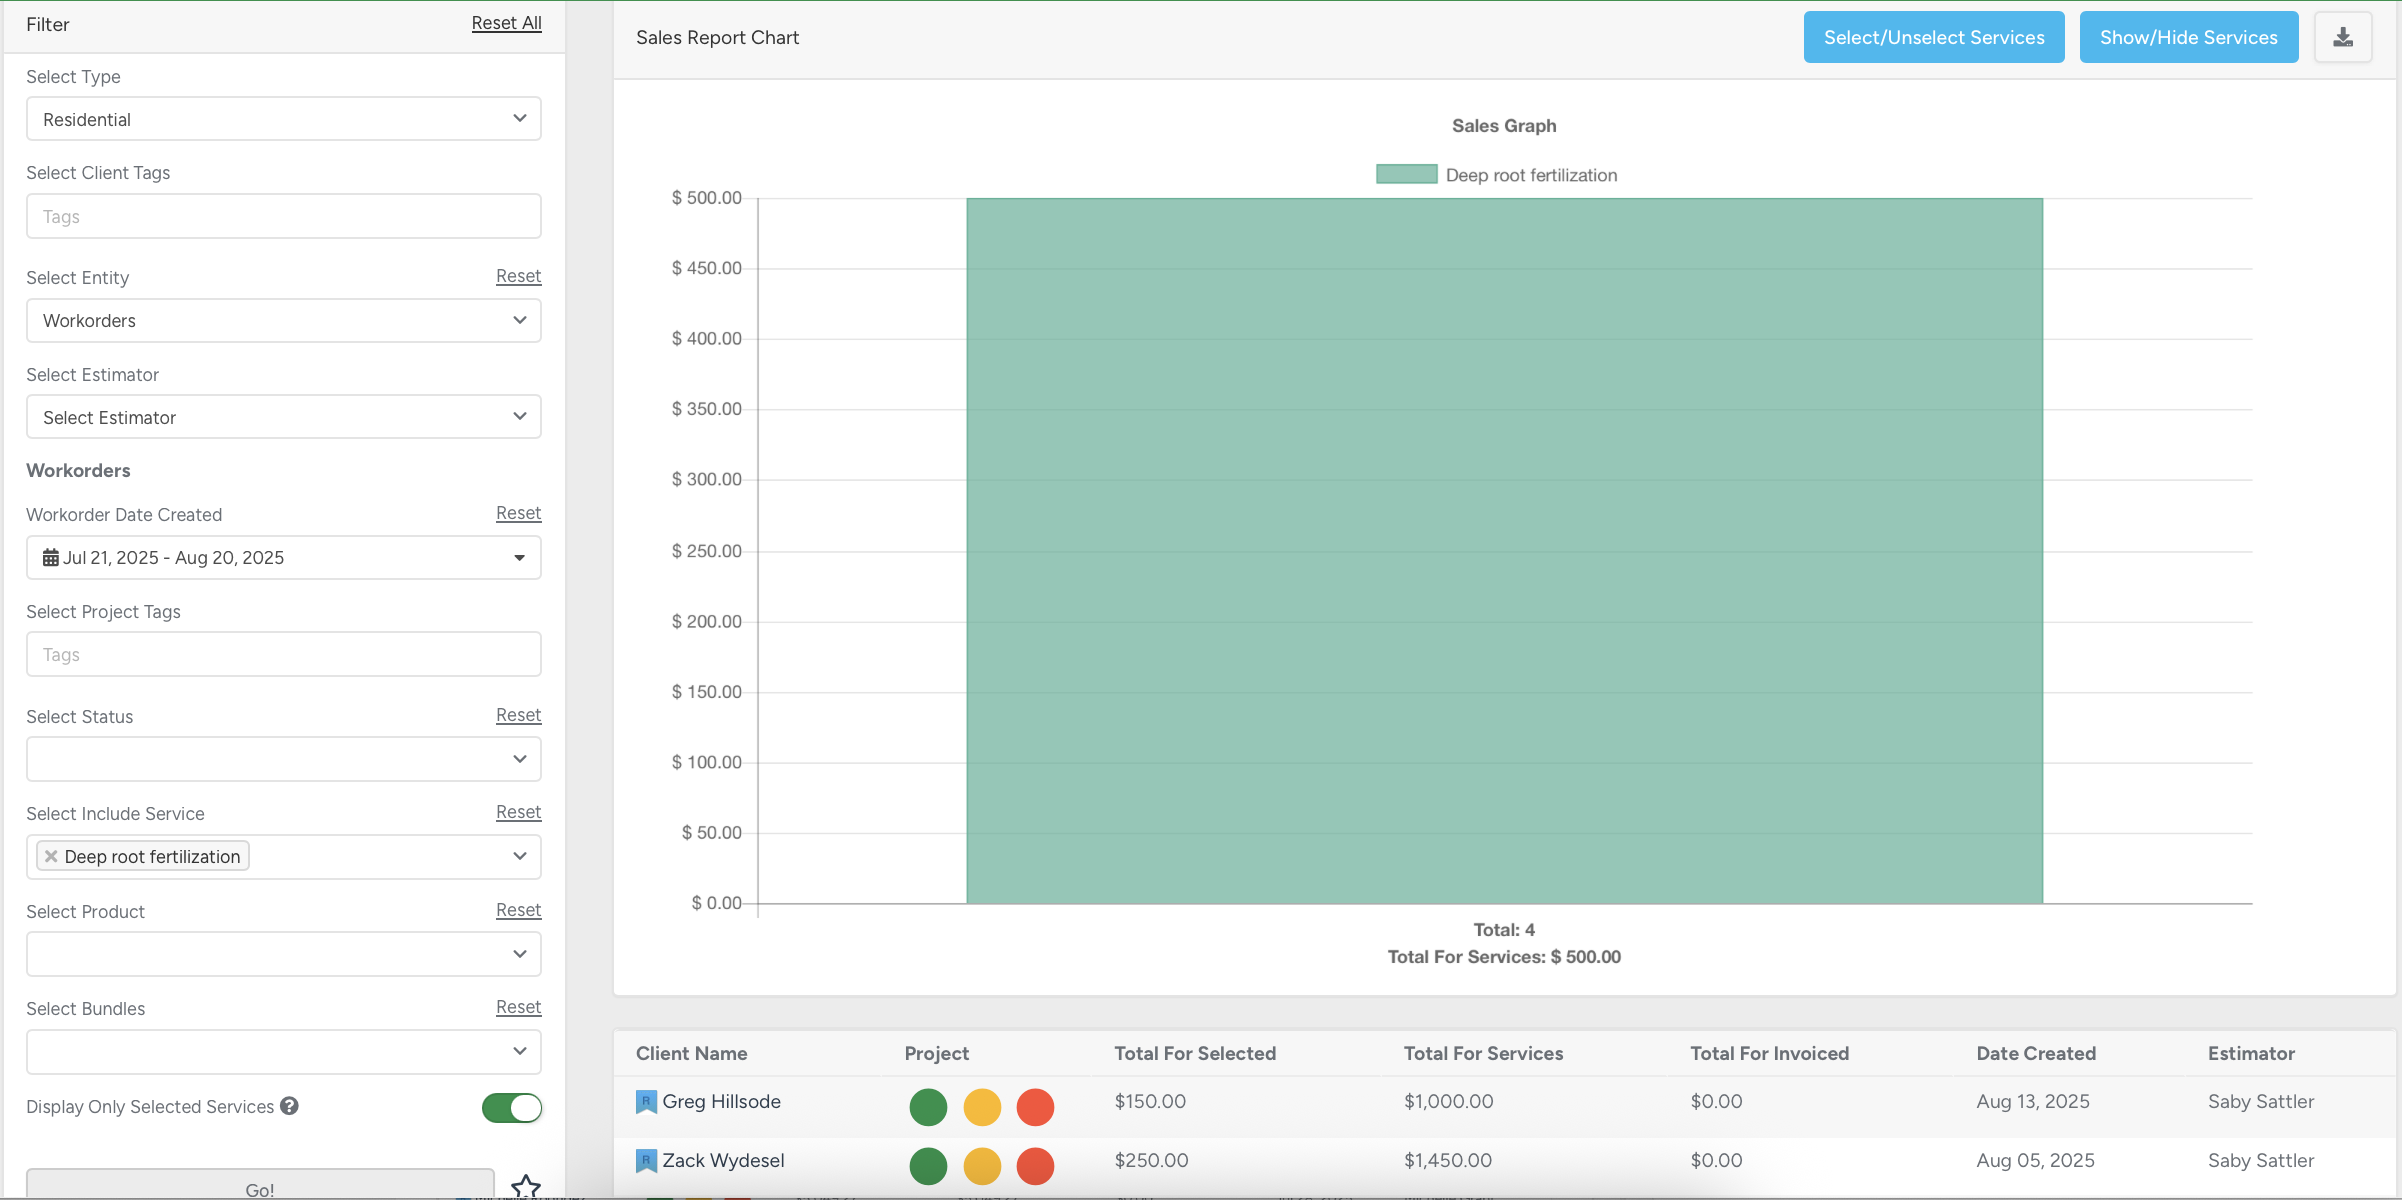
To display only the chosen service, click “Display Only Selected Services” and then “Go”.
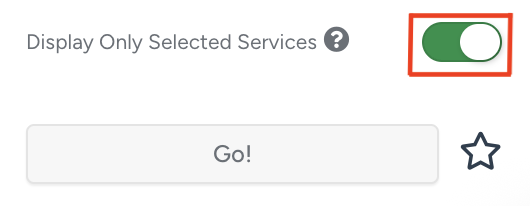
As a result, only the selected service will appear in the report.
Below the chart, you will find a table with client, project, financial, and estimator details.
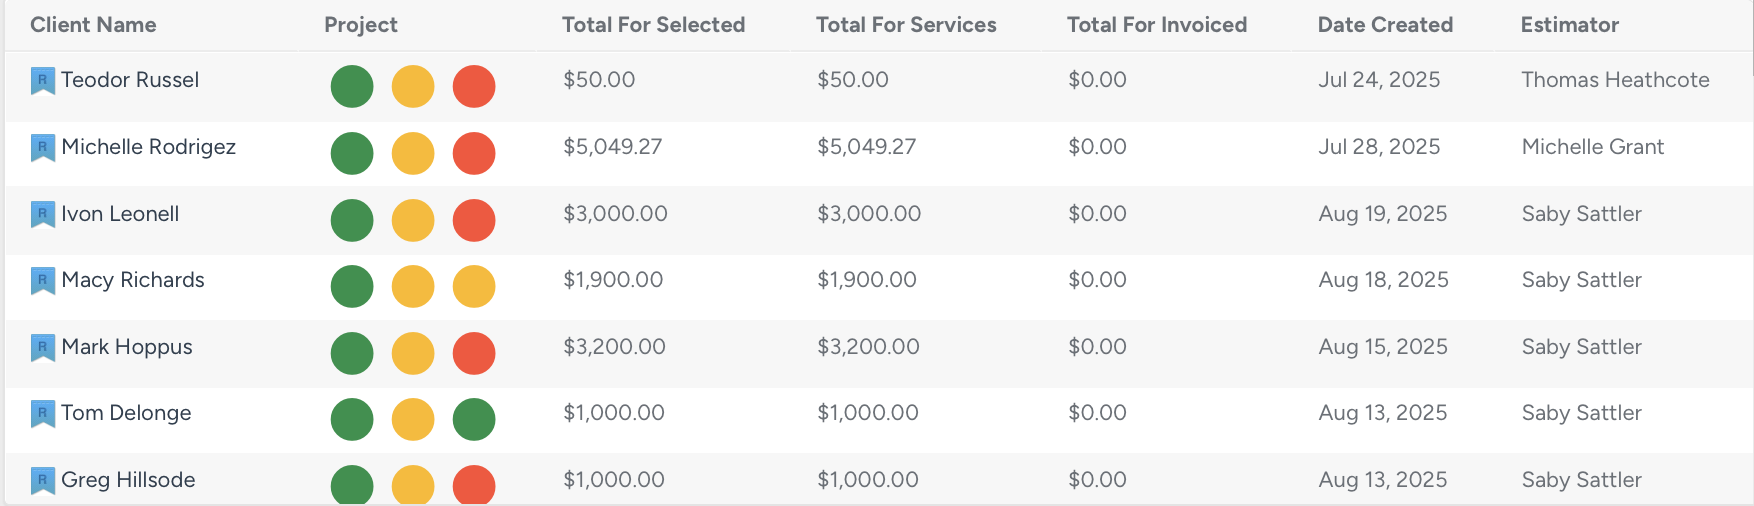
Clicking on a client’s name will take you to their profile.
In the Project column, you will see three dots representing Estimate, Work Order, and Invoice, in that exact order.
Hovering over a dot displays whether it corresponds to an Estimate, Work Order, or Invoice, along with its system number.
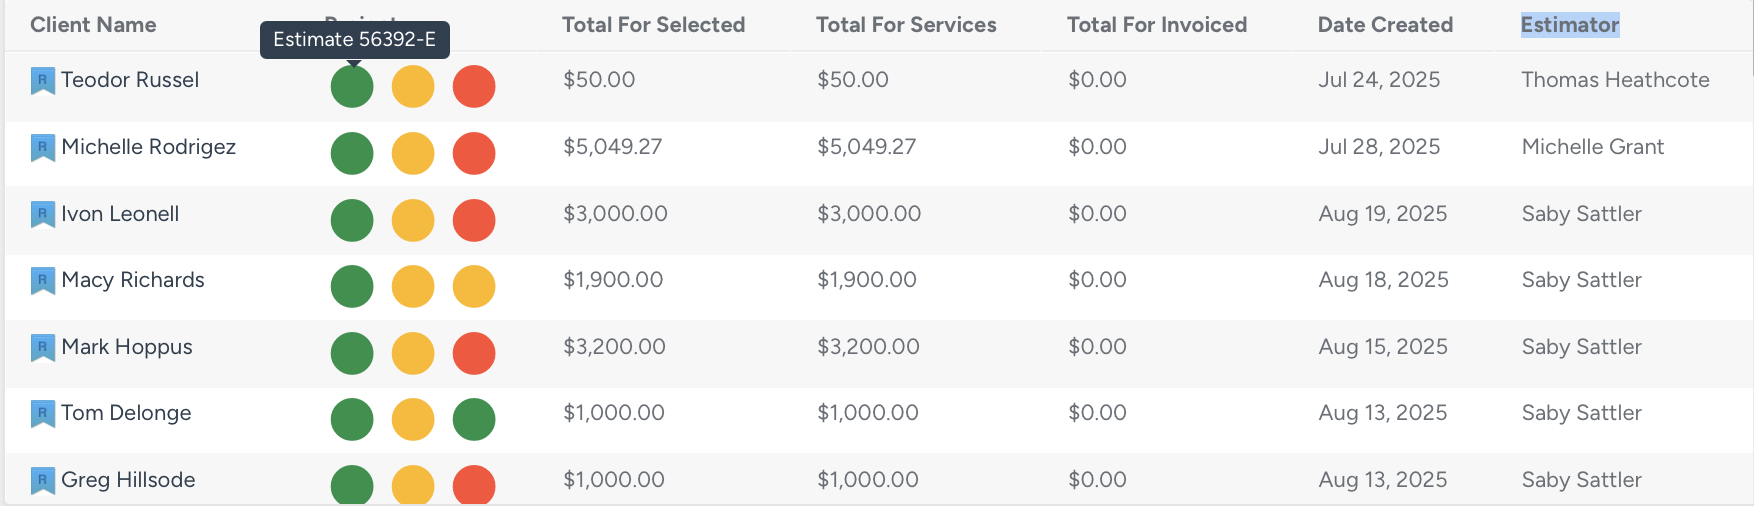
Clicking a dot will take you directly to the respective project’s Estimate, Work Order, or Invoice page.
The colors of the dots indicate their status:
- Green — Complete
- Yellow — In Progress
- Red — Not Found (does not exist)
If you select a specific status in the filter, only that status will be displayed in the table, and dots of other statuses (with their colors) will not be shown.
The Total for Selected column displays the total for services that were selected in the filter.
The Total for Services column shows the full price for all services included in the project.
The Total for Invoiced column reflects the final invoice amount, including taxes.
The Date Created and Estimator columns provide information about when the project was created and who the estimator was.
These insights allow you to monitor sales performance, track completed and in-progress work, and make informed, data-driven decisions to optimize your projects and services.